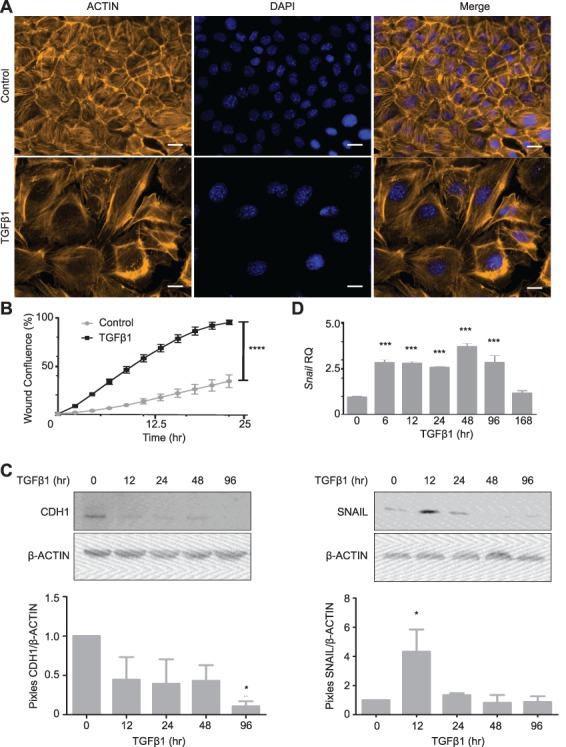
Figure 1.

Epithelial-to-mesenchymal transition in mOSE cells treated with TGFβ1 (10 ng/mL). A: mOSE cells display actin cytoskeletal rearrangement upon TGFβ1 treatment (4 d), as determined by ACTIN immunofluorescence (representative image, N = 6). B: TGFβ1 enhances mOSE cell migration for 24 h of treatment compared to untreated controls (N = 3, ANCOVA, R2 = 0.82 and 0.97 for control and TGFβ1 treatment respectively). C: TGFβ1 treatment of mOSE cells decreases CDH1 (91% at 96 h of treatment) compared to untreated controls, as determined by western blot. β-ACTIN was used as a loading control (representative western blot, N = 3, One-way ANOVA with Dunnett’s post-test). D: mOSE cells treated with TGFβ1 have increased Snail expression compared to untreated controls, as determined by Q-PCR (top) and western blot (bottom). β-ACTIN was used as a loading control. mOSE cells were treated with TGFβ1 for up to 168 h for Q-PCR and up to 96 h for western blot (N = 3, One-way ANOVA with Dunnett’s post-test). *** and **** indicate a significant difference from the untreated control group, P < 0.001 and P < 0.0001 respectively. Scale bar = 15 μm. RQ = relative quantity. Experiments were performed using cells under passage number 25.
