Figure 4.

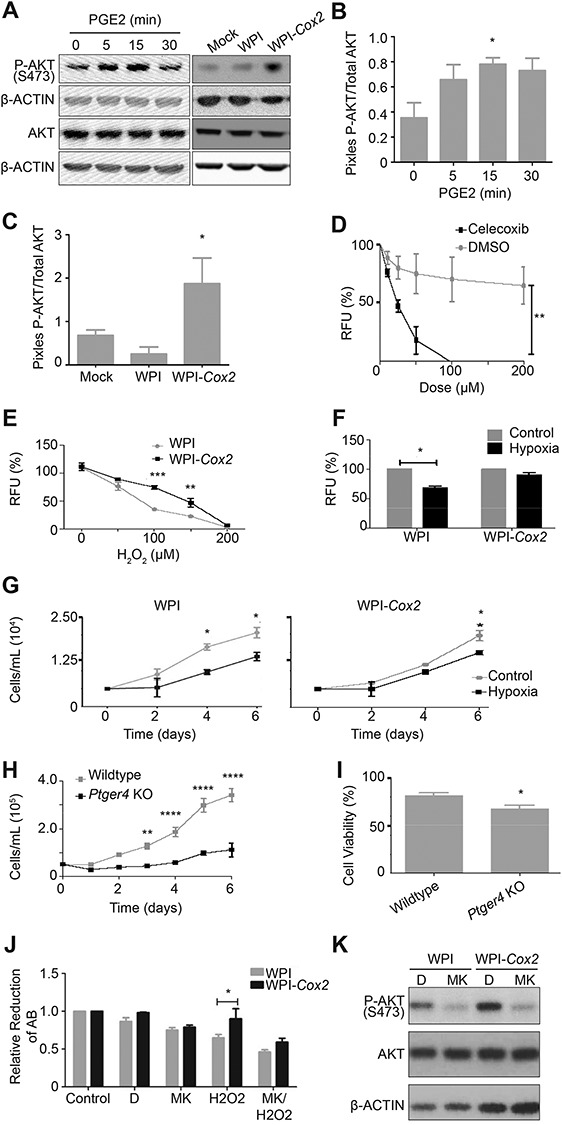
Constitutive Cox2 overexpression and PGE2 treatment promote cell survival through the PTGER4 receptor and activation of AKT signaling. A–C: mOSE cells either treated with PGE2 (8 μg/mL, up to 30 min), or overexpressing Cox2 (WPI-Cox2) have increased levels of P-AKT compared to control cells or mOSE cells infected with the vector control (WPI) as determined by western blot. β-ACTIN was used as a loading control (representative western blot, N = 3, One-way ANOVA with Dunnett’s post-test). D: mOSE cells treated with celecoxib (2 days) have reduced viability compared to control-treated mOSE cells (DMSO), as determined by an Alamar Blue assay (N = 3, Two-way ANOVA with Bonferroni’s post-test). E: WPI-Cox2 mOSE cells are more resistant to H2O2 treatment than WPI mOSE cells, as determined using an Alamar Blue assay after 2 days of treatment (N = 3, Two-way ANOVA with Bonferroni’s post-test). F: WPI mOSE cells cultured in low oxygen (5% O2, 6 days) have reduced viability compared to WPI-Cox2 mOSE cells which maintain their viability, as determined using an Alamar Blue assay (N = 3, Student t-test). G: WPI mOSE cells cultured under low oxygen have decreased proliferation at 4 days in culture whereas WPI-Cox2 mOSE cells maintain their proliferation rate at least until 6 days in culture (N = 3, Two-way ANOVA with Bonferroni’s post-test). H-I: Ptger4 knockout mOSE cells (Ptger4 KO) have reduced proliferation and viability compared to Ptger4 wildtype mOSE cells (wildtype), as determined using a growth curve (H, N = 3, Two-way ANOVA with Bonferroni’s post-test) and trypan blue exclusion (I, N = 3, Student t-test). J-K: The enhanced viability of WPI-Cox2 mOSE cells treated with H2O2 (100 μM, 48 h) compared to WPI mOSE cells is no longer present when pre-treated for 30 min with the P-AKT inhibitor MK-2206 (MK, 2 μM), as determined by an Alamar Blue assay (J, N = 3, Two-way ANOVA with Bonferroni’s post-test, AB = Alamar Blue). Western blot (K) was used to show the efficiency of P-AKT inhibition of the vehicle-treated (DMSO, D) and MK-treated (2 μM, 5 h) mOSE cells. β-ACTIN was used as a loading control for the western blot (representative western blot, N = 3). *, **, ***, **** indicate a significant difference from the untreated control or wildtype group, P < 0.05, 0.01, 0.001, and 0.0001, respectively. RFU = relative fluorescence units. Experiments were performed using cells under passage number 25.
