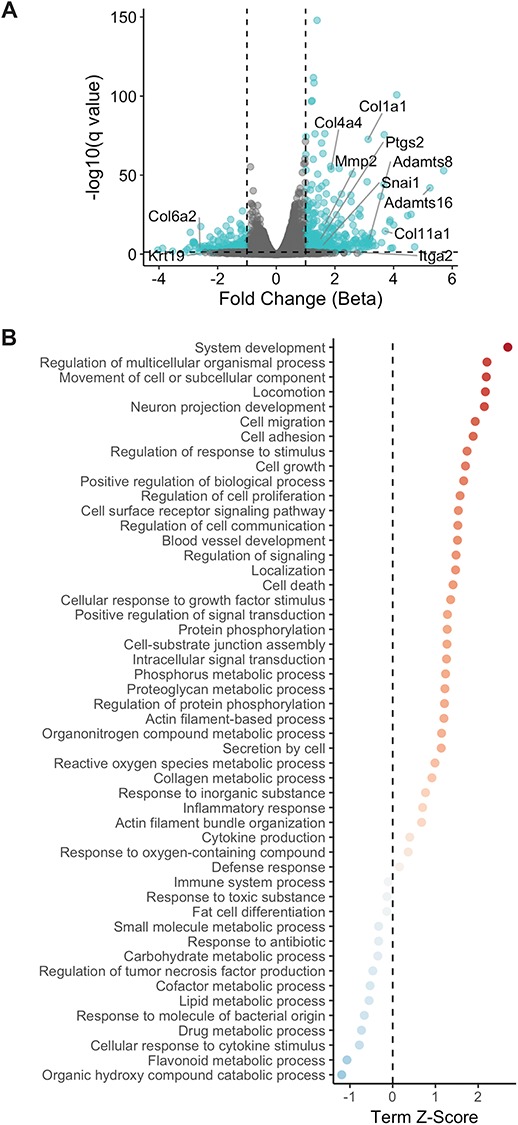
Figure 6.

RNA sequencing results of TGFβ1-treated mOSE cells (10 ng/mL, 96 h) shows increased ECM deposition with treatment. A: Volcano plot demonstrating increased expression of ECM deposition and remodeling genes observed with TGFβ1 treatment. Ptgs2 (Cox2) and Snail are also increased with TGFβ1 treatment whereas Krt19 is decreased with treatment. Fold change was determined by assessing the beta coefficient of the general linear models used for differential expression analysis B: Plot of significantly enriched terms upregulated and downregulated by TGFβ1 treatment. Experiments were performed using cells under passage number 25.
