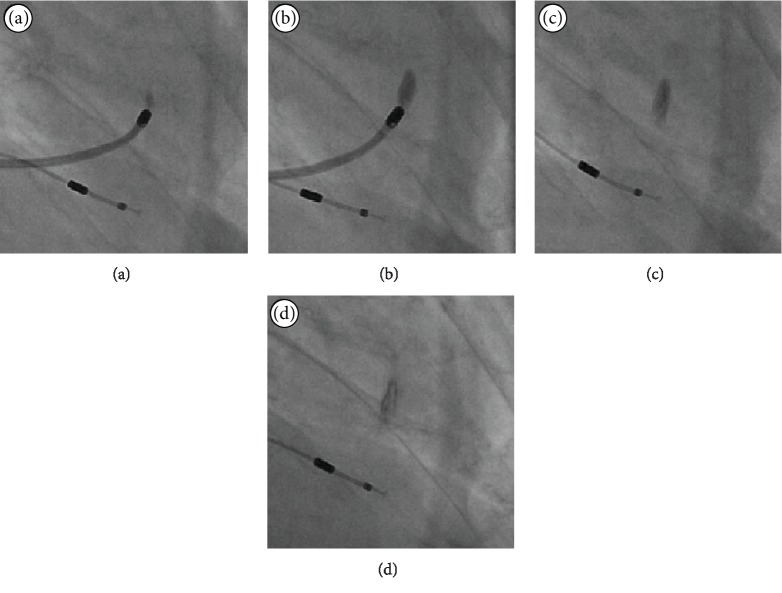
Figure 1.
NOGA injection dispersion pattern. X-ray images demonstrate the immediate dispersion pattern of an injected solution using the NOGA system, in this instance, iodine contrast. Images (a) and (b) depict the start and end of injection over approximately one minute, while images (c) and (d) after 2 and 3 minutes.

