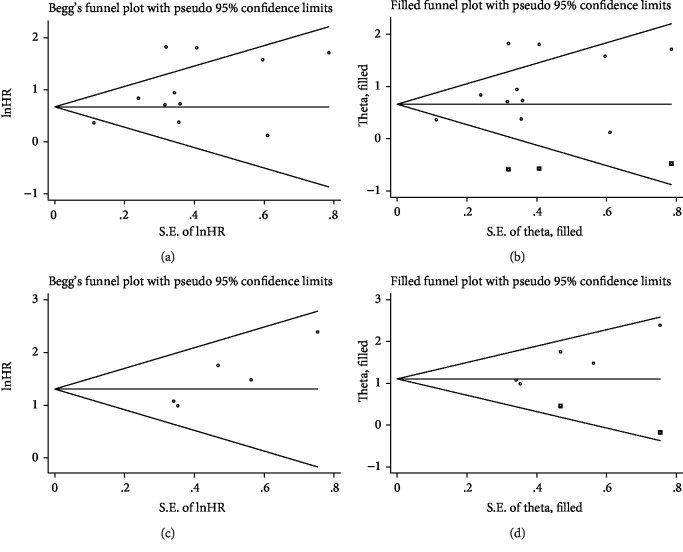
Figure 5.
Begg's funnel plots assessing potential publication bias in studies of APRI in patients with chronic hepatitis. Each study is represented by one circle. The horizontal line represents the pooled effect estimate. (a) Funnel plot of publication bias for studies reporting risk of HCC pretreatment APRI. (b) Funnel plot adjusted with trim-and-fill methods for studies reporting risk of HCC pretreatment APRI. (c) Funnel plot of publication bias for studies reporting risk of HCC posttreatment APRI. (d) Funnel plot adjusted with trim-and-fill methods for studies reporting risk of HCC posttreatment APRI.

