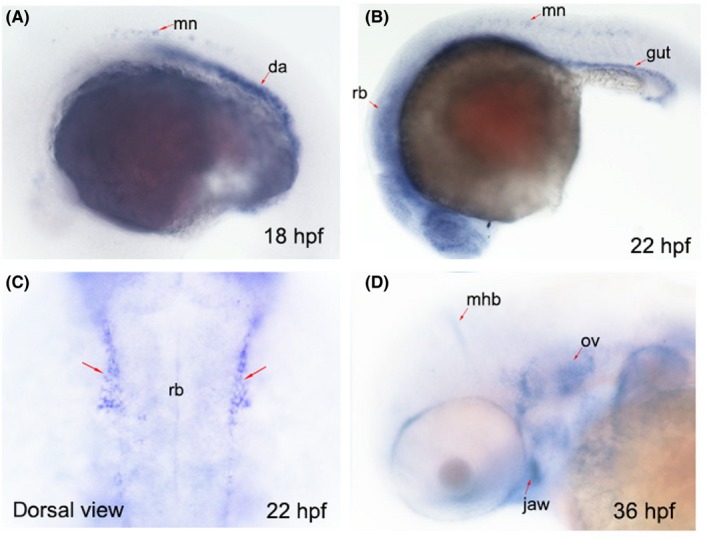
Figure 1.

The expression patterns of sema3E at different developmental time points. A, The expression pattern of endogenous sema3E transcripts at 18 hpf. Red arrows indicate the expression in motor neurons and dorsal aorta; mn, motor neurons; da, dorsal aorta. B, The expression pattern of endogenous sema3E transcripts at 22 hpf. Red arrows indicate the expression of sema3E in motor neurons and gut; mn, motor neurons. C, The dorsal view of the expression pattern of endogenous sema3E transcripts at 22 hpf. Red arrows indicate the expression of sema3E at the periphery of the hindbrain; rb, rhombomere. D, The expression pattern of endogenous sema3E transcripts at 36 hpf. Red arrows indicate the expression of sema3E at the periphery of the hindbrain; rb, rhombomere; mhb, midbrain‐hindbrain boundary; ov, otic vesicle
