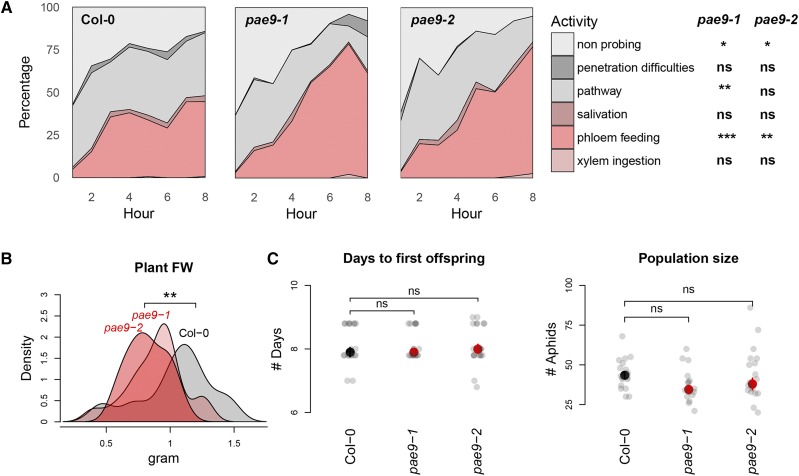
Figure 3.
Effects of pae9-2 mutants on M. persicae aphids. A, Aphid feeding behavior during 8-h EPG recordings, expressed as the mean percentage of time per hour (‘pathway’= cell wall penetration phase, significance of plant line × time interactions in linear mixed model: *P < 0.05, **P < 0.01, ***P < 0.001, n = 14, for Col-0 the mean of two experiments is depicted; ns, not significant). B, Plant fresh weight (FW; density diagram, P = 0.0091, n = 20, one-way ANOVA). C, Aphid development time from neonate to adult and aphid population sizes after 2 weeks of infestation with one neonate (P = 0.07, P = 0.68, n = 20, mixed linear model with plant fresh weight as random effect). Gray dots represent individual data points, red or black dots represent the mean value, and the error bar the 95% confidence interval.

