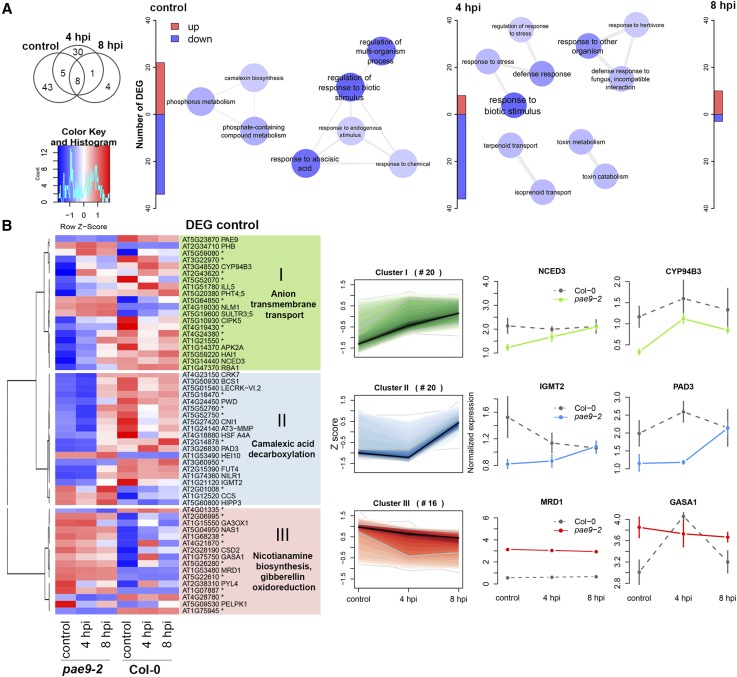
Figure 4.
Transcriptome of the pae9-2 mutant. A, The number of differentially expressed genes (DEGs) in the pae9-2 mutant relative to Col-0, and GO enrichment of down-regulated genes. B, DEGs in the control treatment with hierarchical clustering on perturbations (Ward’s minimum variance method on z-scores). Clusters are illustrated with GO enrichment, perturbation signature, and two exemplary genes (values represent mean normalized expression and bars depict ses). Genes without names are annotated with an asterisk in the heatmap.

