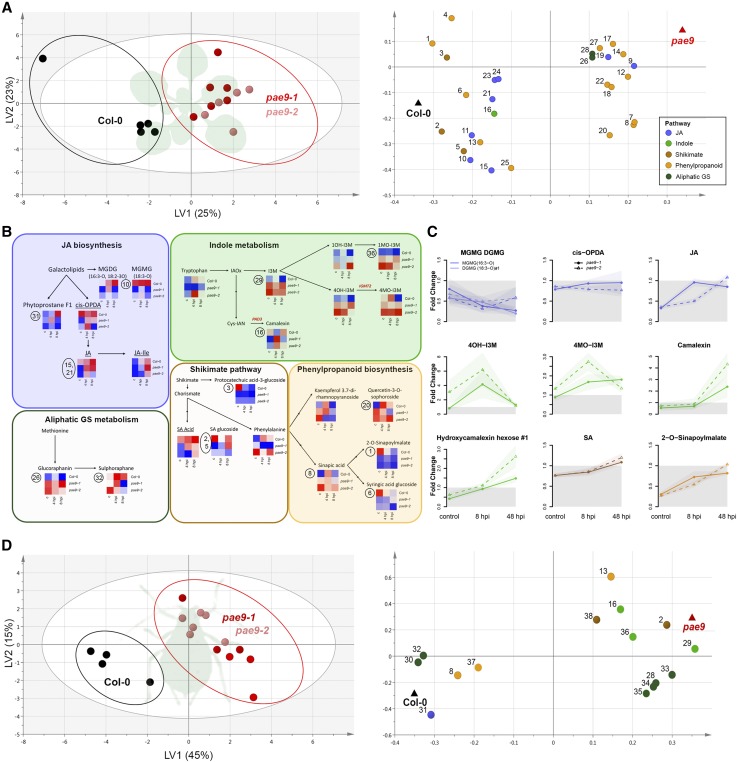
Figure 6.
Secondary metabolite profile of the pae9 mutant and wild-type rosettes and M. persicae aphids. A, Secondary metabolites in uninfested plants (PLS-DA based on the relative quantification of 28 secondary metabolites with VIP score > 1; Table 2; Supplemental Table S5). B, Metabolite pathways and metabolite perturbations in control, 4-hpi, and 8-hpi treatments (heatmaps: blue = low, red = high, encircled numbers refer to compounds in (A) and (D), absolute quantified phytohormone conjugates are underlined, pathways are simplified). C, Effects of 8-h and 48-h aphid infestation on pae9-1 and pae9-2 metabolite abundance compared with Col-0 (colored according to metabolite pathways, gray area is down-regulated, points represent mean fold change, lighter shades se). D, Accumulation of plant secondary metabolites in aphids that had been feeding from either pae9 mutants or Col-0 plants for 10 d (PLS-DA based on relative quantification of 15 secondary metabolites with VIP score > 1; Table 2; Supplemental Table S9). LV1, latent variable 1, LV2, latent variable 2.

