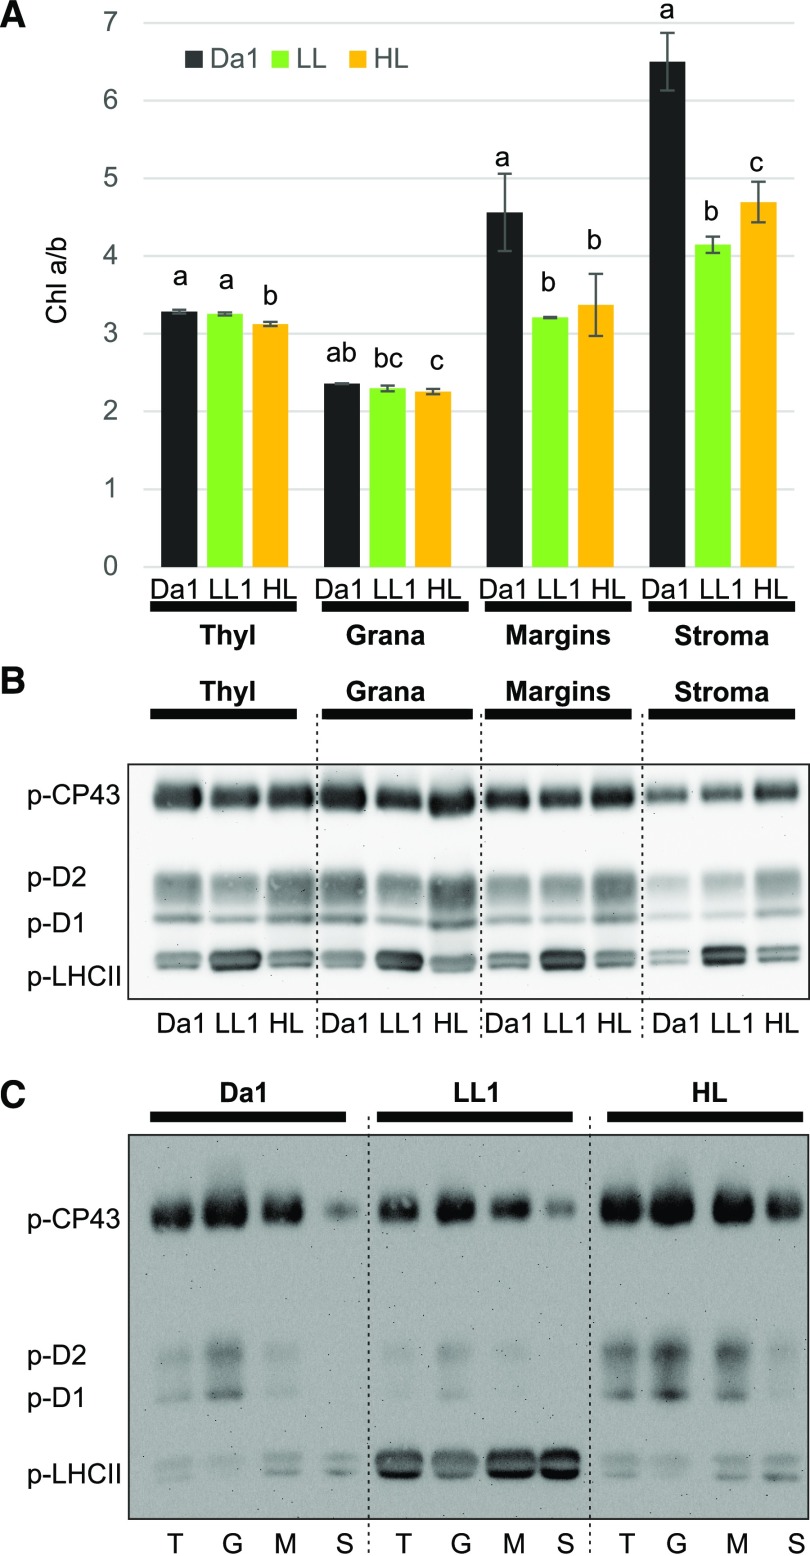
Figure 7.
Effect of light intensity shifts on chl a/b ratios and protein phosphorylation in different thylakoid subfractions. A, Chl a/b ratio in thylakoid fractions obtained with 0.4% digitonin (DIG) from 16-h dark-adapted plants (dark bars) subsequently treated with LL for 2 h (green bars) followed by 2 h HL (orange bars). The letters indicate a statistical difference among light treatments in each fraction (P < 0.05 according to all-pairwise multiple-comparison one-way ANOVA). Error bars indicate the SD (n = 3). B, Representative immunoblot of the fractions in A loaded on a chl basis (0.5 µg) and immunodecorated with antip-Thr antibody. C, Representative immunoblot, as in B, where the fractions were loaded to facilitate comparison between fractions within the same light treatment. T, Thylakoids; G, grana core; M, margins; S, stroma lamellae.

