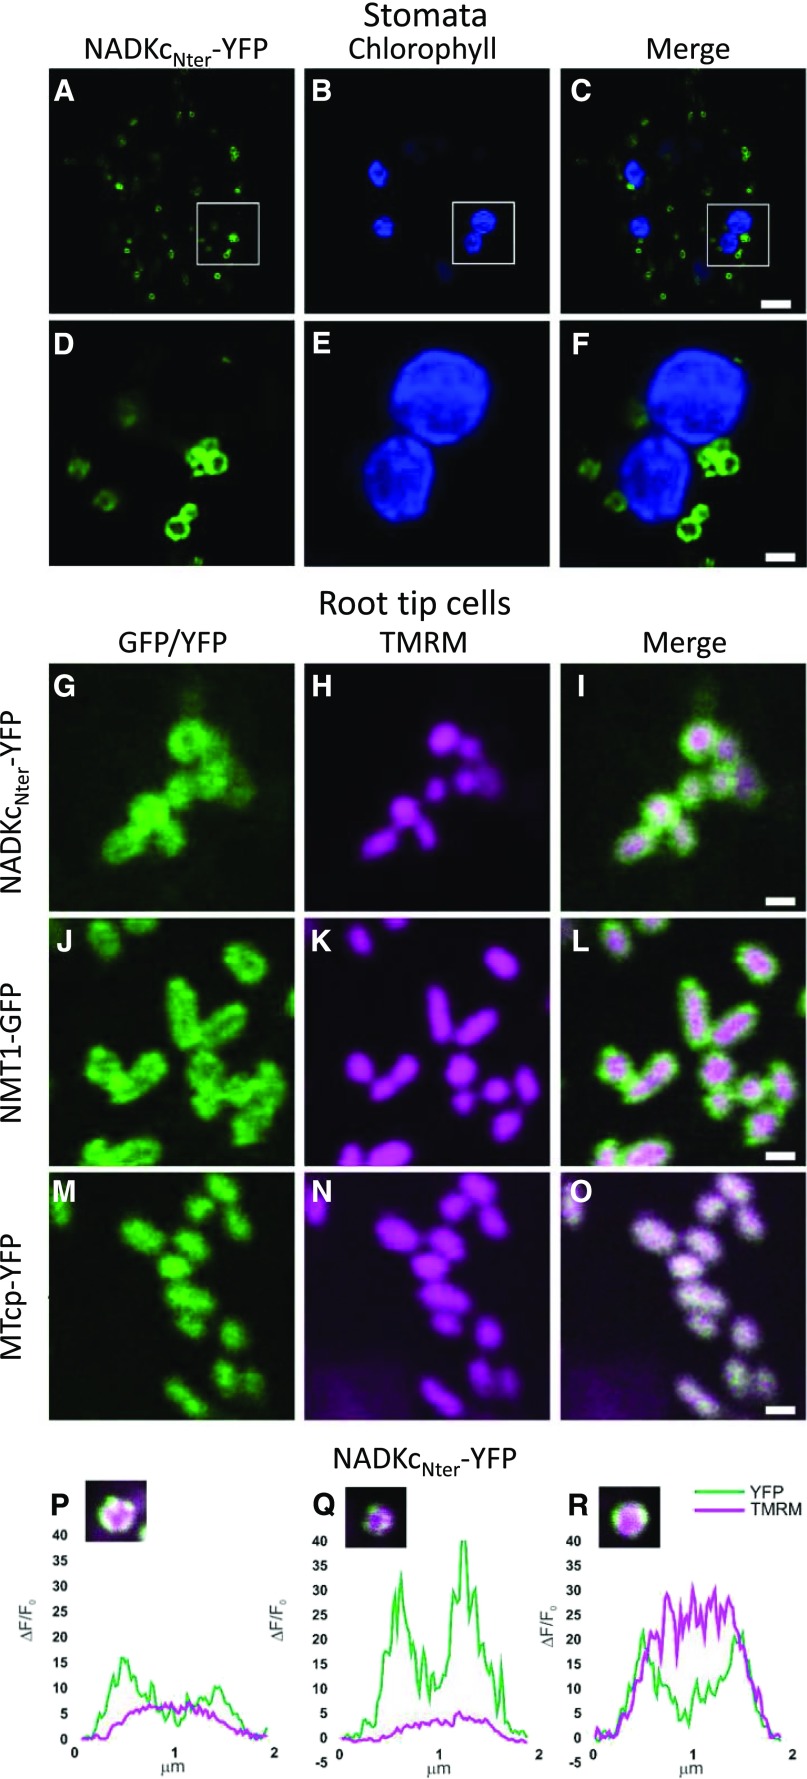
Figure 2.
Analysis of submitochondrial localization of NADKcNter-YFP. A to C, Confocal laser scanning microscopy images from stomata guard cells of a representative Arabidopsis seedling stably expressing NADKcNter-YFP. Bar = 5 µm. D to F, Higher magnification of the regions of interest shown in A to C (white squares). Bar = 1 µm. A and D, YFP fluorescence in green. B and E, Chlorophyll fluorescence in blue. C and F, Merged YFP and chlorophyll fluorescences. G to I, Confocal laser scanning microscopy images from root tip cells of a representative Arabidopsis seedling stably expressing NADKcNter-YFP and stained with the mitochondrial matrix marker TMRM. Bar = 1 µm. J to L, Confocal laser scanning microscopy images from root tip cells of a representative Arabidopsis seedling stably expressing NMT-GFP and stained with the mitochondrial matrix marker TMRM. Bar = 1 µm. M to O, Confocal laser scanning microscopy images from root tip cells of a representative Arabidopsis seedling stably expressing MT-cpYFP and stained with the mitochondrial matrix marker TMRM. Bar = 1 µm. G and M, YFP fluorescence in green. J, GFP fluorescence in green. H, K, and N, TMRM fluorescence in magenta. I, L, and O, Merged YFP/GFP and TMRM fluorescences. NMT1-GFP and MT-cpYFP were used as markers for the outer mitochondrial membrane and matrix, respectively. P to R, Normalized pixel intensity distributions in the YFP and TMRM fluorescence channels plotted centrally across three individual mitochondria of a seedling expressing the NADKcNter-YFP.

