Figure 3.
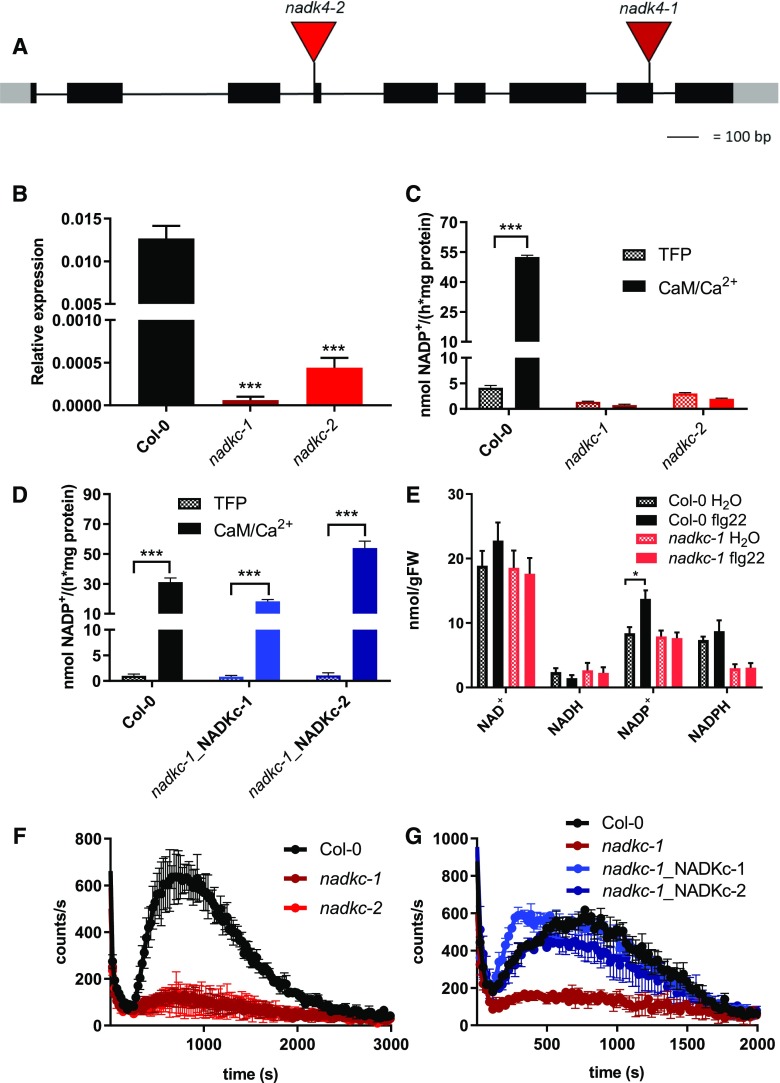
The CaM/Ca2+-dependent NAD+ kinase activity of Arabidopsis seedlings is absent in nadkc mutants. A, Schematic representation of the NADKc gene and positions of the T-DNA insertions in the nadkc-1 and nadkc-2 mutant lines. B, NADKc transcript levels in Col-0 and nadkc mutant seedlings. Levels are expressed relative to those of GAPDH. Data shown correspond to means ± sd, n = 3. C, NAD+ kinase activity measured in Col-0 and nadkc mutant plants (7-d-old whole plantlets) in the presence of the CaM inhibitor TFP (40 μm) or AtCaM1 (250 nm) and Ca2+ (0.5 mm). Data shown correspond to means ± sd, n = 4. D, NAD+ kinase activity measured in 7-d-old Col-0 and mutant whole plantlets complemented with NADKc (nadkc-1_NADKc-1 and nadkc-1_NADKc-2) in the presence of the CaM inhibitor TFP (40 μm) or AtCaM1 (250 nm) and Ca2+ (0.5 mm). E, NAD(P)+ and NAD(P)H concentrations in 7-d-old seedlings exposed (flg22; 1 μm) or unexposed (H2O) for 12 min to the bacterial elicitor flg22. Eighty to 100 mg of tissue was used per measurement. Data shown correspond to means ± sd for three biological replicates. FW, Fresh weight. F, Flg22 (1 μm)-induced oxidative burst in 7-d-old Col-0 and nadkc mutant seedlings (30 plantlets per well). Data shown correspond to means ± sd for four wells. G, Flg22 (1 μm)-induced oxidative burst in Col-0, nadkc-1 mutant, and mutant plants complemented with NADKc (nadkc-1_NADKc-1 and nadkc-1_NADKc-2) measured in 7-d-old seedlings, 30 plantlets per well. Data shown correspond to means ± sd for four wells. Asterisks indicate significant differences between two conditions based on Welch’s t test (*, P < 0.05 and ***, P < 0.001).

