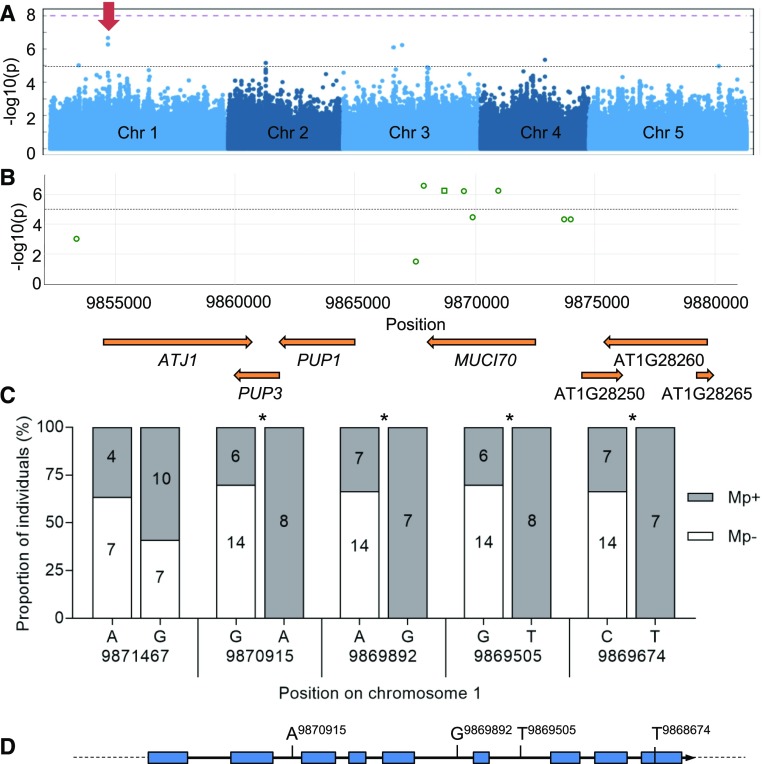
Figure 5.
GWAS of Arabidopsis seed outer mucilage links MUCI70 to variations in polysaccharide molar mass. A, Manhattan plot showing the individual SNPs associated with the outer mucilage polysaccharide trait Mp using a panel of 193 natural accessions and the accelerated mixed-model GWA method. The log-transformed P values from the test of association are plotted as a function of chromosomal position. The genome-wide significance threshold (purple dashed line) was corrected for multiple testings by the Bonferroni method. The black dashed line represents the –log(P) = 5 threshold for significance used in this study. The red arrow indicates the peak on chromosome 1 presented in the closeup in B. Manhattan plots were obtained from GWA-Portal (https://gwas.gmi.oeaw.ac.at/). B, Closeup view of the significant peak on chromosome 1. The most significant SNPs, indicated with green outlines, are found inside the MUCI70 (At1g28240) sequence (mac > 15). Squares indicate synonymous coding polymorphisms, and circles indicate SNPs located in introns or intergenic regions. C, Frequency of SNPs in MUCI70 for 28 accessions classed as outliers for the Mp trait. Histograms indicate the proportions of SNPs for five genome positions; only the nucleotide variants in Supplemental Table S6 that are observed for at least six of the outlier accessions are shown. Asterisks indicate alleles present with significantly different proportions from that expected with a random distribution (χ2 test, P < 0.05). D, Polymorphisms relative to Col-0 found within MUCI70 DNA sequence from the Arabidopsis 1001 Genome Browser (http://signal.salk.edu/atg1001/3.0/gebrowser.php) enriched in high Mp outlier accessions.

