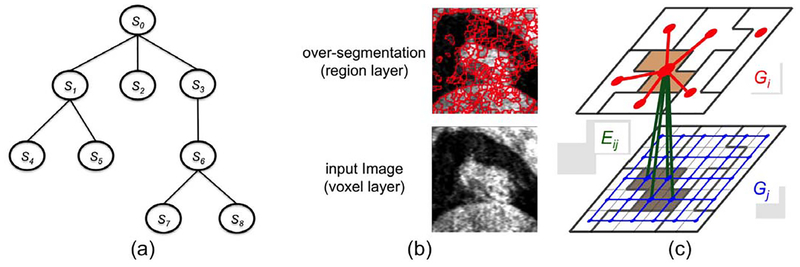
Fig. 1.
(a) The hierarchical interaction structure of an image in different scale levels forms a tree. (b) An example image in the original voxel level of scale (lower panel) and in the regional level of scale with over-segmentation (upper panel). (c) Illustrating the graph construction for two hierarchically interacted images Si and Sj in different scale levels.

