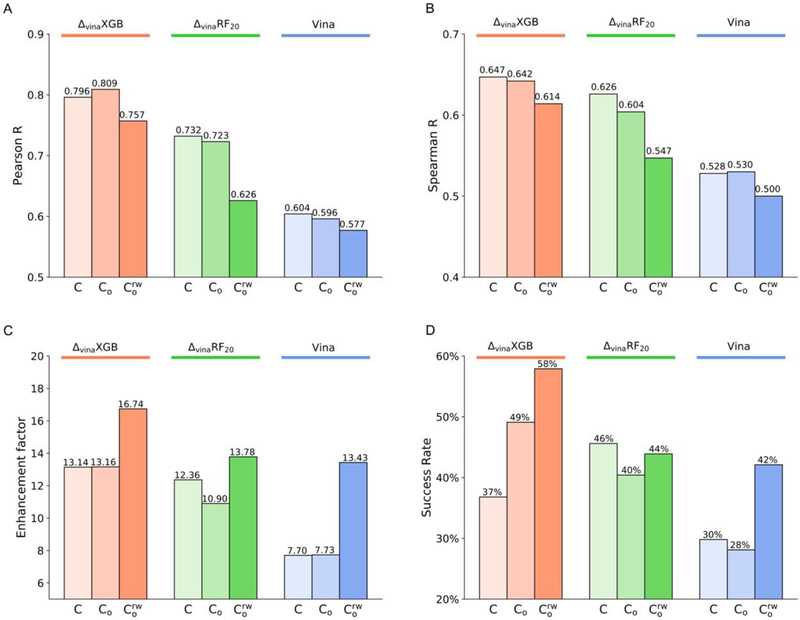
Figure 3.
Performances of ΔvinaXGB, ΔvinaRF20 and Vina on LocalOpt. (A) Pearson correlation coefficient for scoring power. (B) Spearman correlation coefficient for ranking power. (C) Enhancement factor and (D) success rate for screening power at top 1% level. Performances of ΔvinaXGB, ΔvinaRF20, and Vina are colored as orange, green, and blue. For each scoring function, performance on crystal structures (C, shown as reference), local optimized poses , and local optimized poses with receptor-bound water molecules are displayed from left to right with gradually changed color.

