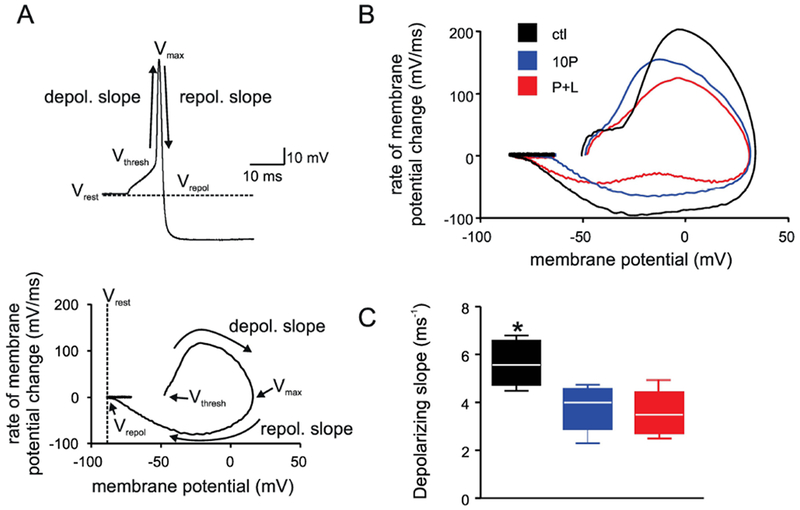
Figure 3. Phase plot analysis of the action potential reveals changes in the depolarizing slope following paraquat treatment.

A. Schematic representation of the phase plot analysis. Top: sample action potential showing the voltage at: rest (Vrest), threshold (Vthresh), peak (Vmax), and repolarization (Vrepol), and the slope for the measurement of depolarizing and repolarizing phases. Bottom: sample phase plot calculated from the above action potential, with the corresponding aforementioned parameters.
B. Representative phase plots from control (black), 10P (blue), and P+L (red).
C. Whisker box plot showing that the slope of repolarization is reduced significantly after paraquat treatment.
Black bar: CTL; blue bar: 10P; red bar: P+L; N=6 cells for all; N=5 animals in control, and N=6 animals in 10P and P+L. *p < 0.05 vs 10P and P+L.
