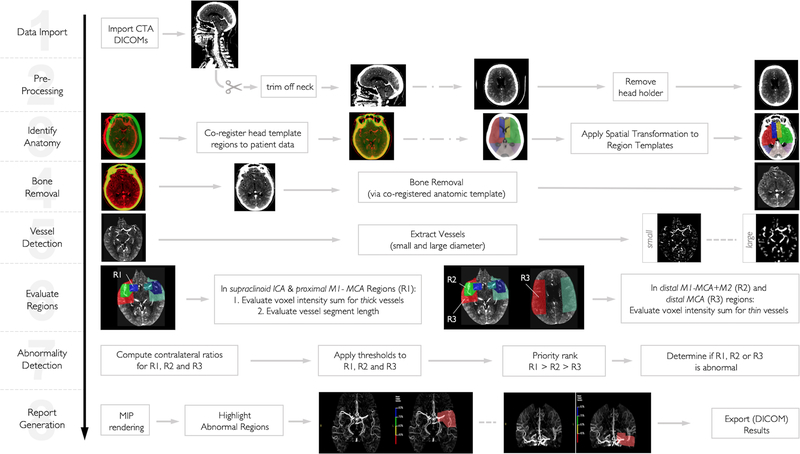
Figure 1 – Pictorial Description of Automatic LVO Detection Algorithm.
After (1) importing raw, thin-slice CTA DICOM images, (2) only slices above C1 are used for further processing and the CT head holder is removed. A (3) CT head template is then co-registered to the patient’s CTA and subsequently the CTA analysis regions (which were previously defined on the CT template) are spatially transformed onto the patient’s CTA scan. Next, all bone is removed (4). Tubular filters are applied (5) to extract vessels. Then, (6) the density (in Hounsfield units) sum of all voxels constituting the large vessels and the density sum of all voxels constituting distal vessels are computed and (7) hemispheric comparisons are made. (8) Areas where the vessel density sum drops below prespecified threshold are highlight as color overlays on maximum intensity projections.

