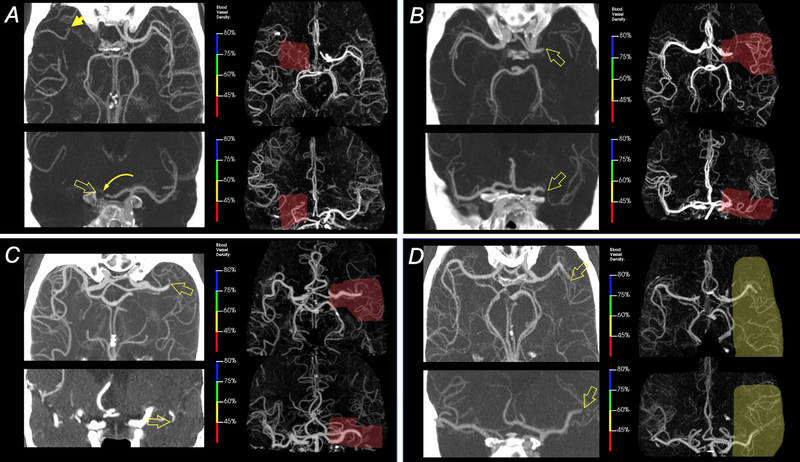
Figure 2 – Example results for automatic LVO detection.
A) 65-yo male with distal ICA occlusion (open arrows) and occlusion of A1-ACA segment (curved arrow) with partial reconstitution of through collaterals (arrow). The area of severe vascular density reduction as determined by the algorithm is shown in red. B) 72-yo female with a left proximal M1-MCA occlusion (open arrows). The area of abnormal density found by the software is highlighted in red. C) 84-yo male with a distal M1 occlusion on the left (open arrows) and the area of abnormal vessel density in red. D) 55-yo male with occlusion of the proximal left superior M2 division (open arrows) and corresponding region picked by the software. The degree of vessel density reduction was less than in the other three patients.

