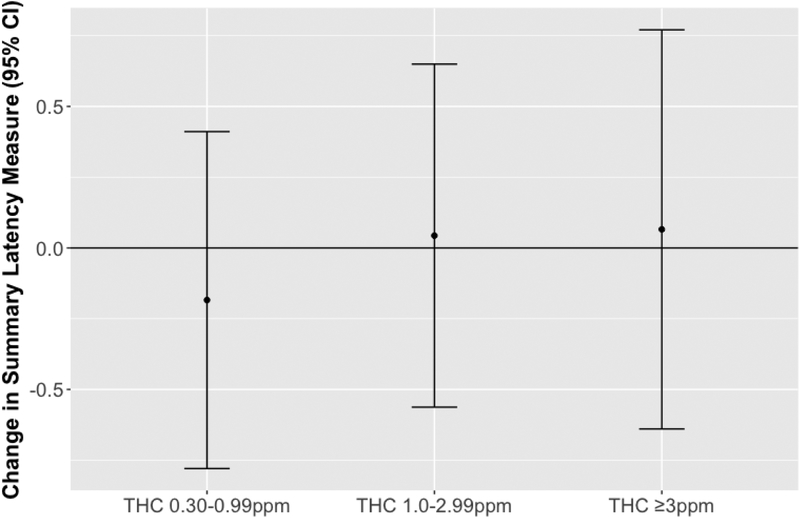
Figure 1.
Summary latency measures and 95% confidence intervals (CI) in relation to maximum total hydrocarbons (THC) levels. The summary latency measure incorporates latency and tap rate measures from 7 neurobehavioral function tests. To create this summary measure, some component measures were negated so that an inverse relationship between exposure and the summary measure indicates an adverse effect of exposure. Each THC category is compared to workers exposed to THC <0.30 ppm (THC <0.30 ppm n=406; THC 0.03–0.99 ppm n=935; THC 1.0–2.99 ppm n=1090; THC ≥3 ppm n=388). Models are adjusted for age, sex, race, education, smoking status, passive smoking, and binge drinking.

