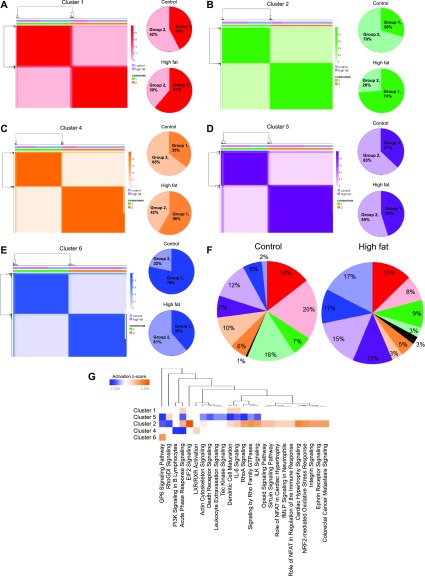
Figure 6. Comparative analyses of control and high-fat/DIO APC subpopulations.
(A, B, C, D, E) NMF clustering on cells in clusters 1, 2, and 4–6 from control and high-fat/DIO conditions. Subclusters are shown with color gradients in consensus matrices generated by NMF clustering (left), and their relative proportions in control and high-fat/DIO conditions are shown in pie charts (right). (F) A summary of the distribution of cells in each subcluster with respect to the overall APC pool. (G) Pathways associated with differentially expressed genes in group 2 versus group 1 of each cluster.

