Figure 2.

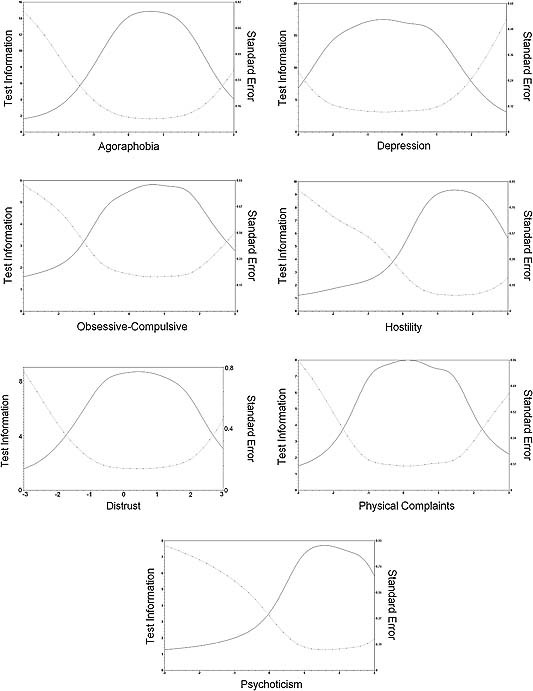
Test information functions for the seven new subscales, with estimated trait score on the horizontal axis, test information (solid line) on the left vertical axis and standard error of measurement (dotted line) on the right vertical axis.

Test information functions for the seven new subscales, with estimated trait score on the horizontal axis, test information (solid line) on the left vertical axis and standard error of measurement (dotted line) on the right vertical axis.