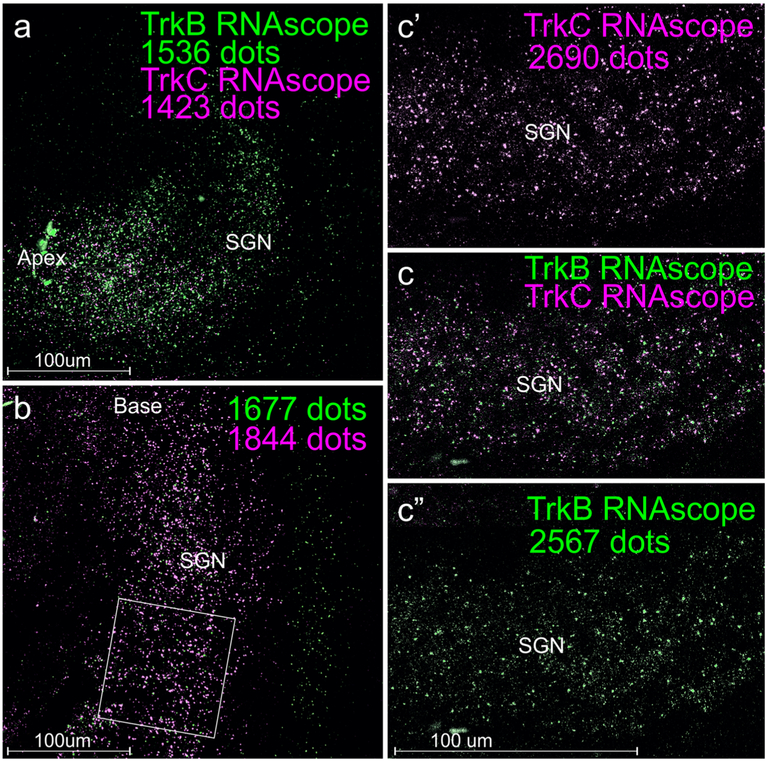
Fig. 4.
Comparison of co-localized neurotrophin receptors using different magnifications. Note that the WH-FISH double labeling shows an apparent gradient within the spiral ganglion neuron populations (SGN). Specifically, at E18.5, there appears to be a stronger expression of neurotrophic tyrosine kinase receptor 2 (Ntrk2, here labeled as TrkB) in the apex (a, more green dots), whereas neurotrophic tyrosine kinase receptor 3 (Ntrk3 here labeled as TrkC) is more prominent in the base (b, more lilac dots). Note that many green (TrkB) dots are outside the area of the SGN and thus should not be quantified. In the middle turn (c), there appears to be also a minor advantage for TrkC dots (c’, c”). Importantly, the total number of dots recognized will co-vary with the magnification and resolution of the lens (20 × 0.75 NA for a, b; 40 × 1.35 NA for c, c’, c”). Square in “b” shows one of three areas used for detailed quantification of dots in Fig. 5

