Figure 2.
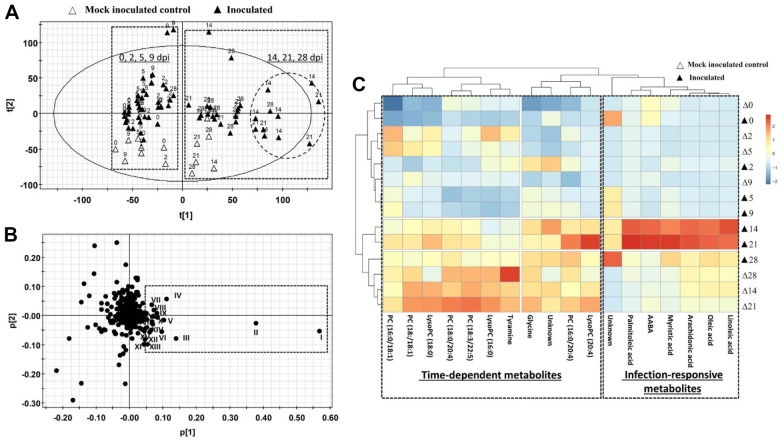
Effects of Mycoplasma hyopneumoniae infection in serum metabolome. Data from LC–MS analysis of serum samples were processed by principal component analysis (PCA). A Score plot of PCA model. Serum samples collected at 0, 2, 5, 9 dpi were separated from those collected at 14, 21, 28 dpi along the 1st principal component of the model (dashed boxes). Additionally, samples from inoculated pigs at 14 and 21 dpi were further separated from other samples (circled). B Loading plot of PCA model. Major markers contributing to sample separation (I–XX) in the PCA model were identified and labeled in the loading plot and further characterized by structural analysis. The identities of these metabolites are presented in Table 1. C Distribution profile of metabolite markers. The heat map from hierarchical cluster analysis classified the metabolite markers as time-dependent metabolites and infection-responsive metabolites.

