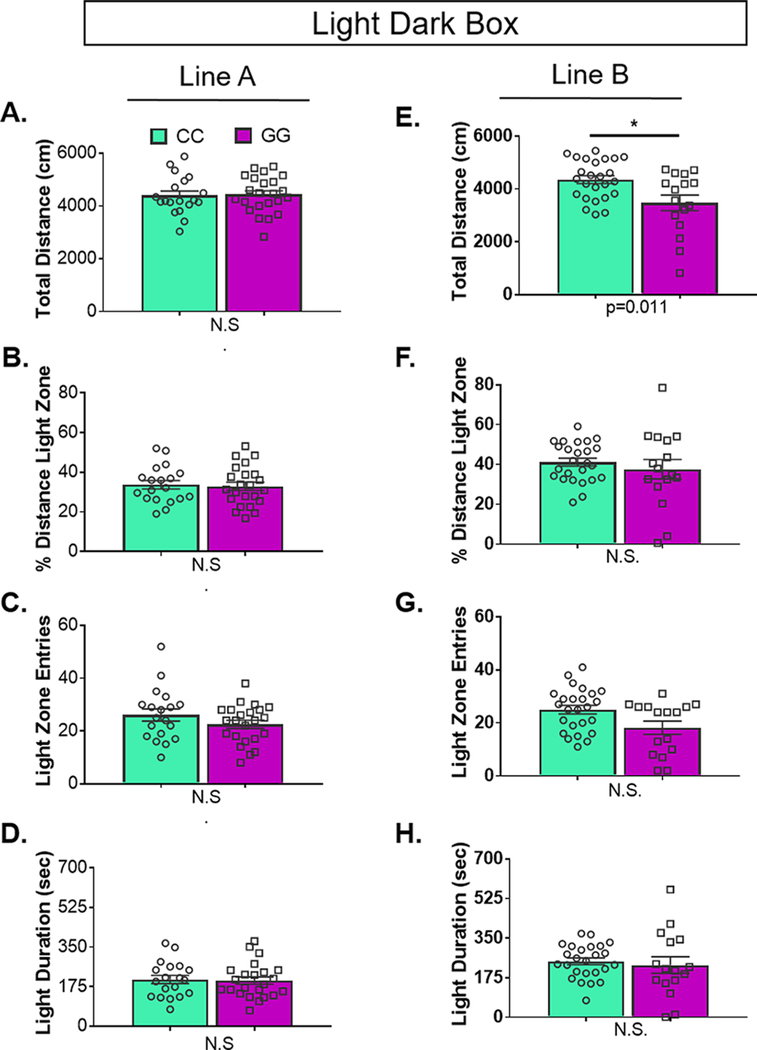
Figure 5.
Genotype-dependent differences in light–dark box behaviors is line specific. (A–D) In line A, there were no differences between genotypes in any of the metrics examined. In contrast, in line B, rs6295CC animals traveled farther (p = 0.011). There were no differences in (G) light zone entries, (F) the percent distance traveled in the light, or (H) light zone duration between genotypes. Values represent mean ± SEM. Group sizes and statistics are available in Supplementary Table 4.

