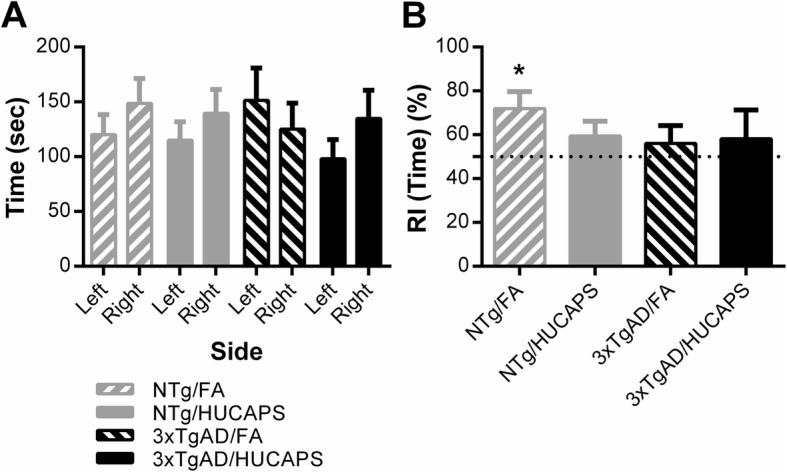
Fig. 6.

NOR Performance: a Total time spent with identical left or right object in session 1. b Calculated recognition indices (RI) were derived from time measures in session 2. The dotted line represents 50% RI or recognition due to chance, above which indicates preference for the novel object. Bars depict group mean ± SE values. * indicates significant difference from chance preference in one sided t-test to all fictive groups. n = 10–11 per group
