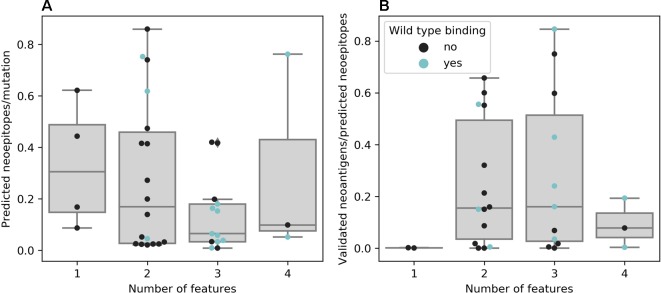
Figure 3.
(A) Neoepitopes per mutation grouped by the number of features used for neoepitope selection. Data based on publications that offered comparable data, e.g., not obviously counting a neoepitope predicted to be presented by multiple major histocompatibility complexes (MHCs) multiple times (n = 38). (B) Ratio of confirmed to predicted neoepitopes grouped by the number of features used for neoepitope selection. Data based on publications that experimentally validated all predicted neoepitopes (n = 30)

