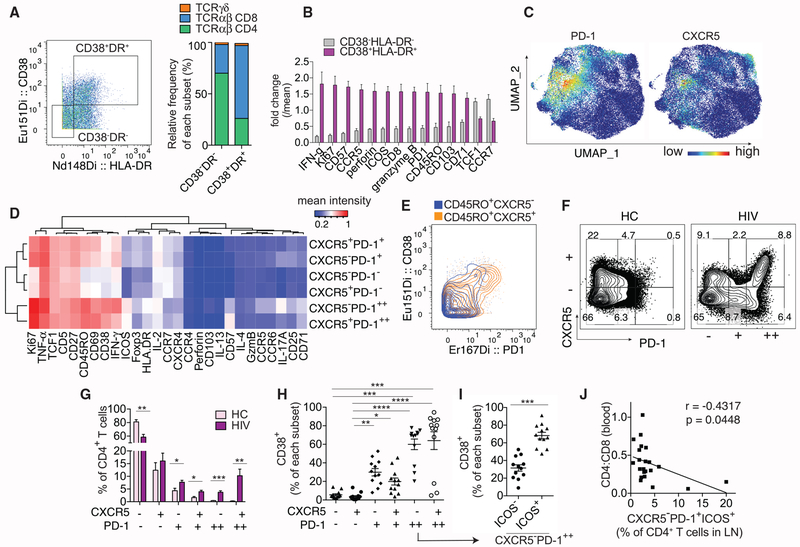
Figure 1. High-Dimensional Analyses of Activated T Cells in HIV-Infected LNs.
(A–E) CyTOF analyses of 8 HIV-infected LNs.
(A) Representative plot and bar graph show the relative contribution of major T cell subsets in HIV-infected LNs by TCR and co-receptor expression.
(B) Plot summarizes fold change over mean signal intensity for differentially expressed markers between CD38−HLA-DR− and CD38+HLA-DR+ CD3+ T cells.
(C) UMAP displays of PD-1 and CXCR5 staining on CD4+ T cells using concatenated data from 8 HIV LN samples.
(D) Heatmap shows the average staining signal of individual markers for each CD4+ T cell subset as indicated. Markers used to select input cells were excluded.
(E) Representative plot showing PD-1 and CD38 co-staining.
(F–J) Flow cytometry analyses of 7 HC and 9 HIV LNs.
(F) Plots showing subdivision of CD4+ T cells by CXCR5 and PD-1 staining on a representative HC or HIV-infected LN sample.
(G) Bar graph quantifies the frequency of each phenotypic subset in HC or HIV-infected LNs.
(H) The frequency of CD38+ T cells within each manually gated CD4+ T cell subset.
(I) The frequency of CD38+ T cells within ICOS− versus ICOS+ subset of CXCR5−PD-1++ T cells.
(J) Correlation between peripheral CD4:CD8 ratio of 22 HIV+ donors and the frequency of CXCR5−PD-1+ICOS+ subset of CD4+ T cells in their LNs.
For (B) and (G), differentially expressed markers were selected using multiple t tests and corrected using Holm-Sidak method. For (H), Friedman test was performed and corrected using Dunnett’s multiple comparisons test. For (I), paired t test was used. Association for (J) was measured by Pearson correlation. Data are represented as mean ± SEM.
Also see Figures S1 and S2.

