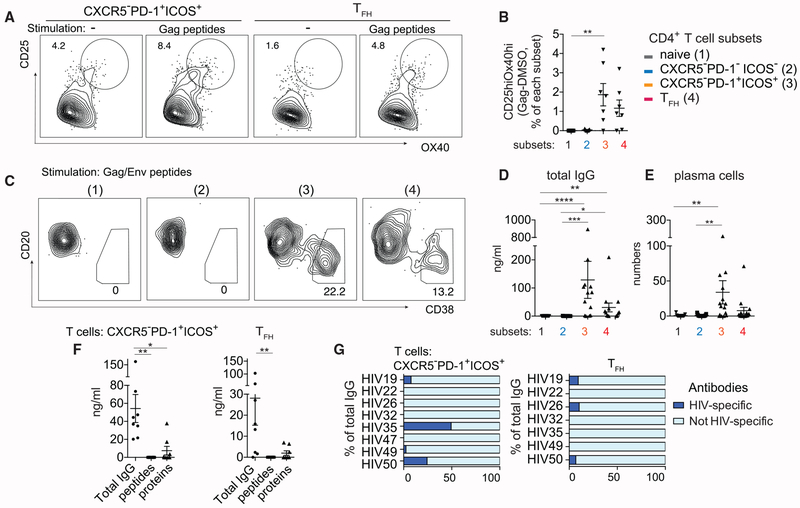
Figure 4. CXCR5−PD-1+ICOS+ T Cells Contain HIV-Specific T Cells that Are Capable of Promoting Both HIV-Specific and Non-HIV-Specific Antibody Responses.
(A) Gag-specific T cells within CXCR5−PD-1+ICOS+ T cells or TFH cells were identified by OX40 and CD25 expression in LN cells stimulated with pooled Gag peptides for 18 h. Plots show representative data from one HIV LN.
(B) Quantification of CD25hiOX40hi T cell frequency. Background level of CD25hiOX40hi T cells in vehicle-treated wells was subtracted from Gag-stimulated wells (n = 7).
(C) Plasma cell phenotype of B cells cocultured with the indicated T cell subsets in the presence of Gag/Env peptides for 7 days. Representative data from one individual is shown.
(D and E) Quantification of IgG concentration (D) or plasma cell number (E) in T:B cell cocultures after 7 days of Gag/Env peptide stimulation (n = 15).
(F) Summary plot comparing total IgG antibody concentration with concentration of antibodies that recognize Gag/Env peptides or proteins. Cocultures contained either CXCR5−PD-1+ICOS+ T cells or TFH cells and were stimulated by Env/Gag peptides.
(G) Bar graphs show the concentration of antibodies specific for Gag/Env protein asapercentage of total IgG produced by B cells in the presence of HIV peptide-stimulated CXCR5−PD-1+ICOS+ T cells or TFH cells. Each bar indicates one individual.
Friedman test was performed and corrected using Dunn’s multiple comparisons test. Data are represented as mean ± SEM.
Also see Figure S6.

