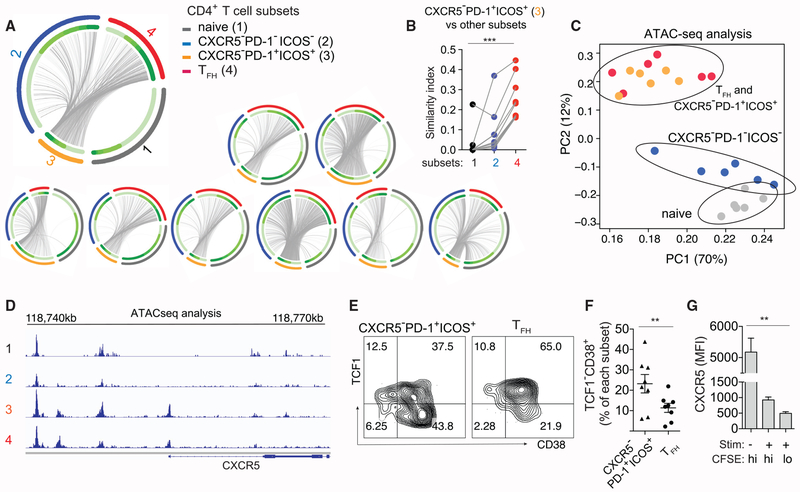
Figure 5. CXCR5−PD-1+ICOS+ T Cells Are Clonally Related to TFH Cells and Exhibit Epigenetic Similarities.
(A) Circos plots of TCR sequence overlap among different populations. Each thin slice of the arc represents a unique TCR sequence, ordered by the clone size (darker green for larger clones, inner circle). Outer circle indicate TCR sequences found in naive, CXCR5−PD-1−ICOS−, CXCR5−PD-1+ICOS+, and TFH cells. Each plot represents data from one individual.
(B) Bhattacharyya coefficient measurement for the TCR repertoire similarity between CXCR5−PD-1+ICOS+ T cells and other populations within LN. Grey lines connect samples from the same patient (n = 9).
(C) Principal-component analysis of ATAC-seq data of LN CD4+ T cell subsets from 6 HIV+ donors. Each symbol represents cells from one donor; cells of the same type are coded by the same color.
(D) Representative chromatin accessibility at the CXCR5 upstream region for each CD4+ T cell subset.
(E) Example plots showing TCF1 and CD38 staining.
(F) Quantification of activated TCF1− T cells among CXCR5−PD-1+ICOS+ T cells and TFH cells in HIV+ LNs (n = 8).
(G) Sorted TFH cells were labeled with carboxyfluorescein succinimidyl ester (CFSE) and treated with SEB or DMSO for 7 days in the presence of B cells. Bar graph quantifies the fluorescence intensity of CXCR5 staining on TFH cells. Cell division was measured by dilution of CFSE staining (n = 6).
For (B) and (G), Friedman test was performed and corrected using Dunn’s multiple comparisons test. For (F), paired t test was used. Data are represented as mean ± SEM.
Also see Figures S5A, S5B, S4E, and S4F.

