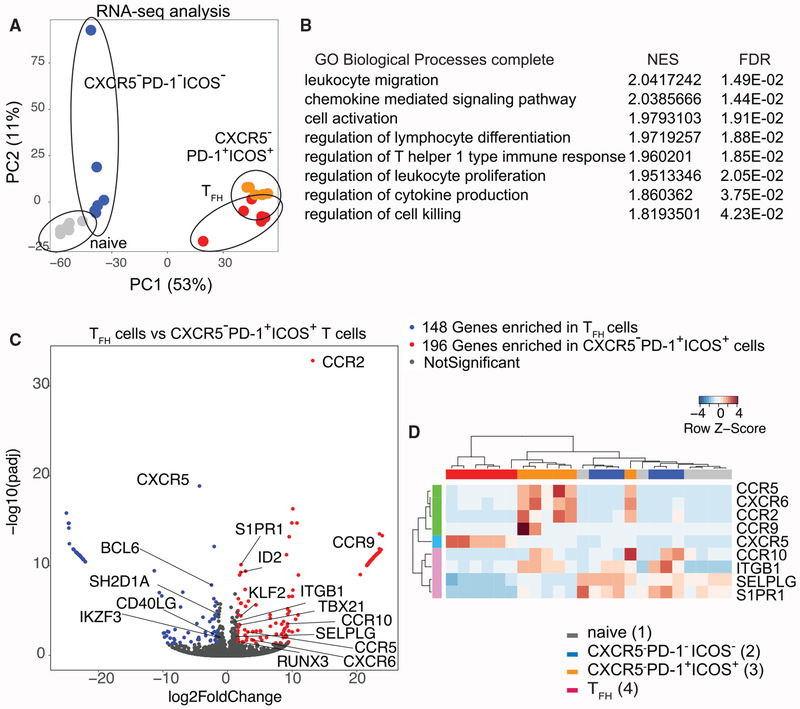
Figure 6. CXCR5−PD-1+ICOS+ T Cells from HIV-Infected LNs Exhibit a Distinct Gene Expression Profile.
(A) Principal-component analysis of RNA-seq data from different CD4+ T cell subsets.
(B) A list of Gene Ontologies based on significantly variant genes compared between CXCR5−PD-1+/CXCR5+PD-1+ T cells called by both GSEA and GOrilla. Normalized enrichment score (NES) and false discovery rate (FDR) were generated from GSEA. A positive enrichment score indicates gene set enrichment in CXCR5−PD-1+ICOS+ T cells.
(C) Volcano plot for comparison between TFH cells and CXCR5−PD-1+ICOS+ cells. The differentially expressed genes were defined with cutoff adjusted p value < 0.05, log2 |foldchange| > 1.5.
(D) Heatmap representing differentially expressed trafficking-related receptors in 4 cell subsets. Gene expression values were normalized and scaled with DESeq2.
Also see Figure S7.

