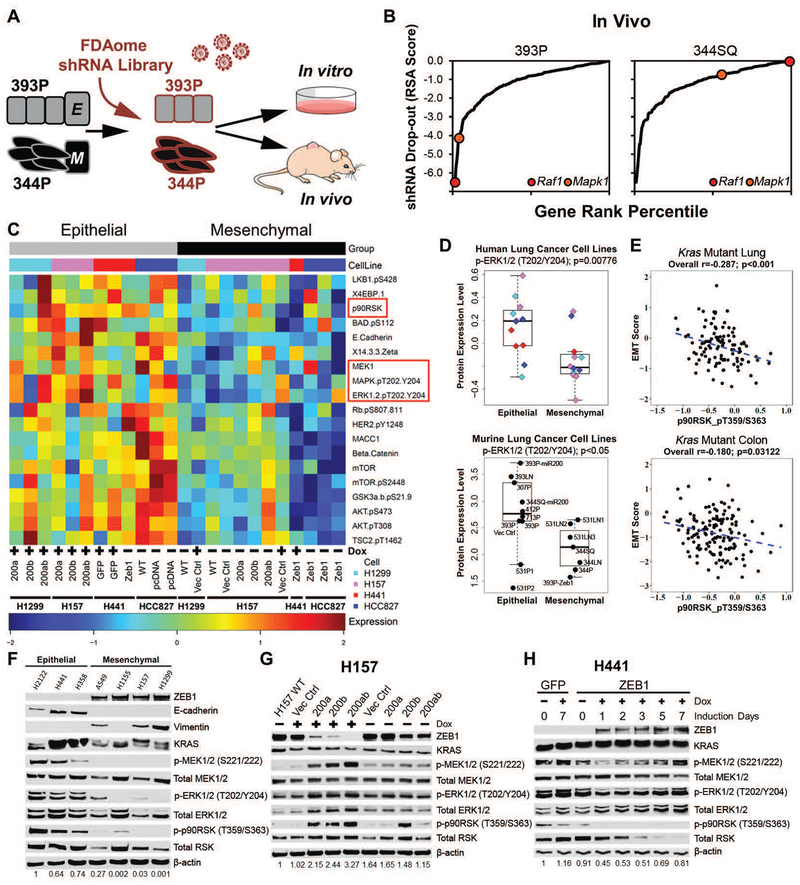
Fig. 1. Epithelial tumors have greater MAPK signaling dependency for growth.
(A) Experimental design for FDAome shRNA drop-out screens in epithelial (393P) and mesenchymal (344P) murine lung cancer cell lines implanted subcutaneously in vivo (nude mice) and grown in parallel in vitro (20 doublings).
(B) Gene rank analysis highlighting the behavior of RAF1 and MAPK1 genes in the FDAome in vivo screens executed in epithelial (393P) and mesenchymal (344P) murine lung cancer cell lines. ShRNA dropout score was calculated as the log of the redundant shRNA activity (RSA) value shown in table S1 in data file S1.
(C) Heatmap of reverse phase protein array (RPPA) profile showing statistically significant (p<0.05) differentially regulated proteins in isogenically-matched epithelial and mesenchymal human lung cancer cell lines. Cell lines expressed doxycycline (Dox) inducible miR-200 or ZEB1, as indicated. ZEB1 was constitutively expressed in HCC827 cells, rather than Dox-inducible.
(D) Dot plot of ERK phosphorylation (T202/Y204) from RPPA dataset in a panel of mesenchymal and epithelial murine (epithelial: 393P, 393P Vector Control, 393P-miR200, 393LN, 307P, 412P, 713P, 531P1, 531P2, 344SQ-miR200; mesenchymal: 531LN1, 531LN2, 531LN3, 344P, 344LN, 344SQ, 393P-Zeb1) and human lung cancer cells.
(E) Cluster plot analysis of Spearman’s rank correlation between EMT score and the activated downstream MAPK signaling molecule p-p90RSK (T359/S363) in KRAS mutant lung and colorectal cancer patient samples from TCGA RPPA datasets.
(F) Western blot of the EMT markers ZEB1, E-cadherin, and vimentin and MAPK signaling molecules in a panel of human KRAS mutant lung cancer cell lines. Numbers at the bottom indicate relative quantification of western blot signal for p-ERK, relative to β-actin.
(G and H) Western blot of indicated proteins in (G) H157 cells after Dox-induced miR-200 expression for 7 days and (H) H441 cells after Dox-induced ZEB1 expression at the indicated time points. Numbers at the bottom indicate relative quantification of western blot signal for p-ERK, relative to β-actin.

