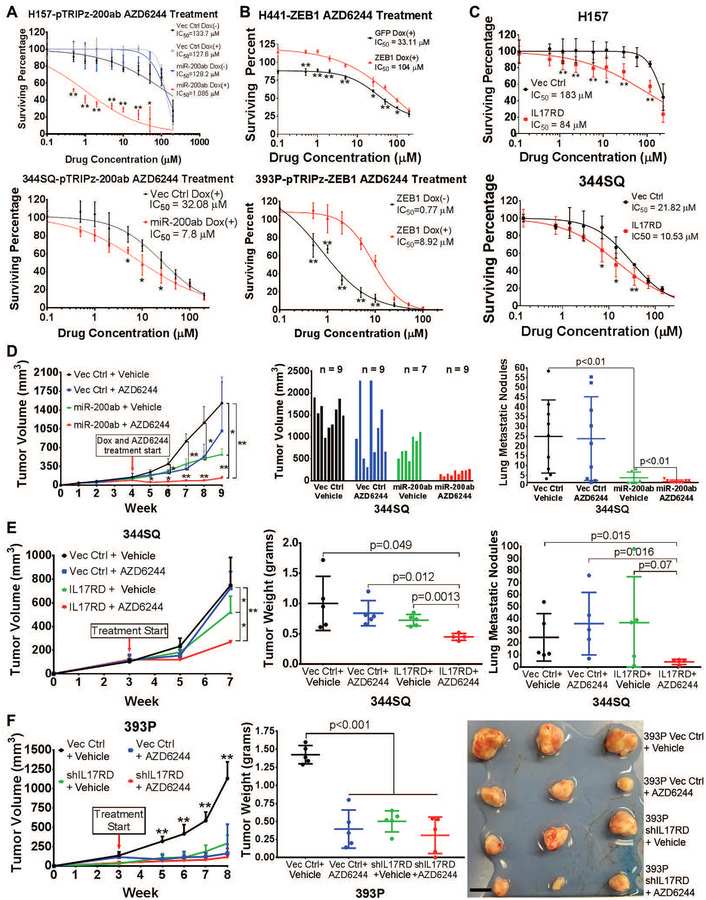
Fig. 5. MiR-200 or IL17RD sensitizes mesenchymal lung tumors to MEK inhibition.
(A-C) In vitro cell survival response after 72 hours of AZD6244 treatment in:
(A) Mesenchymal human H157 (top) and murine 344SQ (bottom) cells with or without inducible miR-200 expression. *: p<0.05, **: p<0.01.
(B) Epithelial human H441 (top) and murine 393P (bottom) cells with or without inducible ZEB1 expression. *: p<0.05, **: p<0.01.
(C) Mesenchymal human H157 (top) and murine 344SQ (bottom) cells with stable vector control or IL17RD expression. *: p<0.05, **: p<0.01.
(D) Left: In vivo subcutaneous tumor volume measurements at the indicated time points for 344SQ tumors +/− doxycycline-inducible miR-200 expression, treated daily with AZD6244 or vehicle control. Starting time of treatment denoted by red arrow. Treatment performed in experimental duplicate with 3 to 5 mice per replicate and total sample size denoted in the middle graph. Tumor volume data plotted as the mean and standard deviation. Middle: Final tumor volume measurements at Week 9 of experiment (5 weeks of treatment). Right: Quantification of lung metastatic surface nodules in the indicated experimental groups at Week 9 of experiment. *: p<0.05, **: p<0.01.
(E) Left: In vivo subcutaneous tumor volume measurements at the indicated time points for 344SQ tumors +/− IL17RD expression, treated daily with AZD6244 or vehicle control. Starting time of treatment denoted by red arrow; n=4 to 5 mice per treatment group. Tumor volume data plotted as the mean and standard deviation. *: p<0.05, **: p<0.01. Middle: Final tumor weight measurements at Week 7 of experiment (4 weeks of treatment). Right: Quantification of lung metastatic surface nodules in the indicated experimental groups at Week 7 of experiment.
(F) Left: In vivo subcutaneous tumor volume measurements at the indicated time points for 393P tumors +/− IL17RD knockdown, treated daily with AZD6244 or vehicle control starting at the time indicated by the red arrow; n = 5 mice per treatment group. Tumor volume data plotted as the mean and standard deviation. Middle: Final tumor weight measurements at Week 8 of experiment (5 weeks of treatment). Right: Images of 3 representative primary subcutaneous tumors for each of the indicated treatment groups. Scale bar, 1 cm. **: p<0.01.

