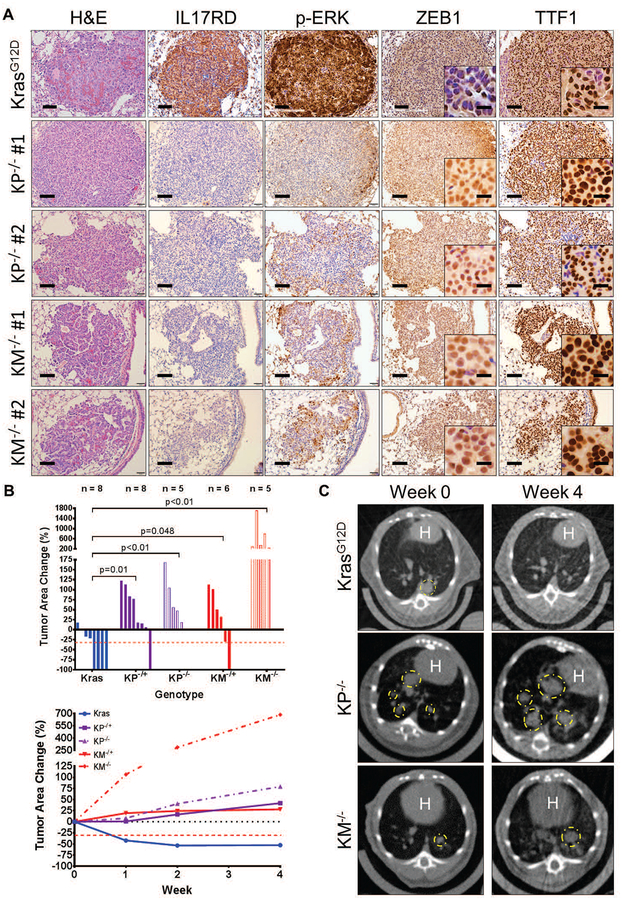
Fig. 6. ZEB1 expression correlates with decreased IL17RD, decreased MAPK signaling, and MEK inhibitor resistance in KRAS mutant mouse lung tumors.
(A) H&E, IL17RD, p-ERK, ZEB1, and TTF1 IHC stains of lung tumor tissue from KrasG12D, KP−/−, and KM−/− mice (n=6 tissues per group). KP and KM lung tumor images show regions from two different mice. Scale bars, 100 μm. Inset scale bars, 20 μm.
(B) Top: Percent change in overall lung tumor area of age-matched KrasG12D, KP−/+, KP−/−, KM−/+, and KM−/− mice after 4 weeks of daily treatment with 25 mg/kg AZD6244, as assessed by micro-CT imaging of mouse lungs. Bottom: Trendlines of percent change in overall tumor area at indicated time points for each cohort over 4 weeks of daily treatment with AZD6244. Mouse sample sizes are indicated in the top graph. Percent change in tumor volume data plotted as the mean.
(C) Representative cross-sectional micro-CT images of KrasG12D, KP−/−, and KM−/− mouse lungs before AZD6244 administration (Week 0) and at the treatment endpoint (Week 4). Yellow circles outline representative target lesions. White “H” indicates mouse heart.

