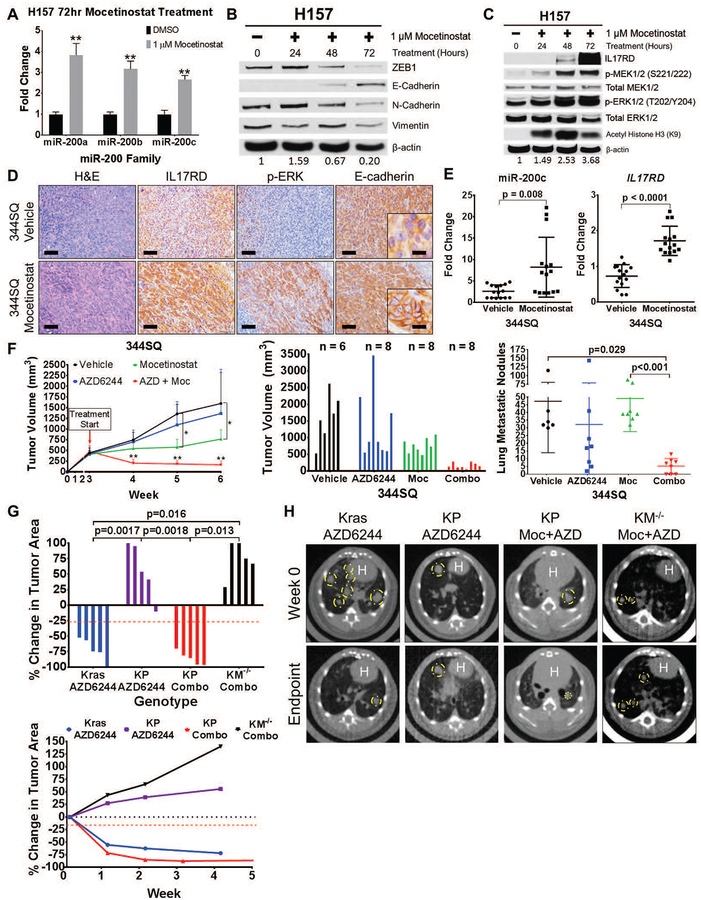
Fig. 7. Mocetinostat increases miR-200 and IL17RD expression and sensitizes resistant tumor cells to MEK inhibition.
(A) QPCR analysis for relative expression of miR-200a, miR-200b, and miR-200c in H157 cells after 72 hours of treatment with mocetinostat. **: p<0.01.
(B) Western blots of EMT markers in H157 cells after treatment with mocetinostat for the indicated time course.
(C) Western blots of IL17RD and MAPK signaling proteins in H157 cells after treatment with mocetinostat for the indicated time course. Acetylated histone (H3K9) is included to confirm HDAC inhibition by mocetinostat.
(D) H&E, IL17RD, p-ERK, and E-cadherin IHC stains of primary 344SQ tumor tissues in syngeneic wild-type mice after 3-week treatment with 80 mg/kg mocetinostat or vehicle control daily (n=5 tumors per group). Scale bars, 100 μm, inset scale bars, 20 μm.
(E) QPCR analysis of miR-200c and IL17RD expression in 344SQ tumor tissues treated with mocetinostat or vehicle control from (D). Technical triplicates of 5 tumor tissue samples from each treatment group were analyzed for each qPCR.
(F) Left: Tumor volume measurements at the indicated time points for 344SQ subcutaneous syngeneic tumors treated daily with single agent 25 mg/kg AZD6244 (AZD), single agent 80 mg/kg mocetinostat (Moc), or both drugs in combination (Combo). Starting time of treatment denoted by red arrow; n=5 mice per treatment group. Tumor volume data plotted as the mean and standard deviation. Middle: Final tumor volume measurements at Week 6 of experiment (3 weeks of treatment). Right: Quantification of lung metastatic surface nodules in the indicated treatment groups at Week 6 of experiment.
(G) Top: Percent change in overall tumor area of KrasLA1-G12D (Kras), KrasLA1-G12D;p53R172HΔG/+ (KP), and KM−/− mice after 4 to 5 weeks of daily treatment with single agent 25 mg/kg AZD6244 or daily combinatorial treatment with AZD6244 and 80 mg/kg mocetinostat (Combo). Bottom: Trendline of percent change in overall tumor area at the indicated time points for Kras, KP, and KM mice with single agent AZD6244 treatment or combinatorial treatment with AZD6244 and mocetinostat; n=5 mice per treatment group. Percent change in tumor volume data plotted as the mean.
(H) Representative micro-CT images of Kras, KP, and KM−/− mice before treatment (Week 0) and at treatment endpoint (Week 4 or Week 5). White “H” indicates location of mouse heart.

