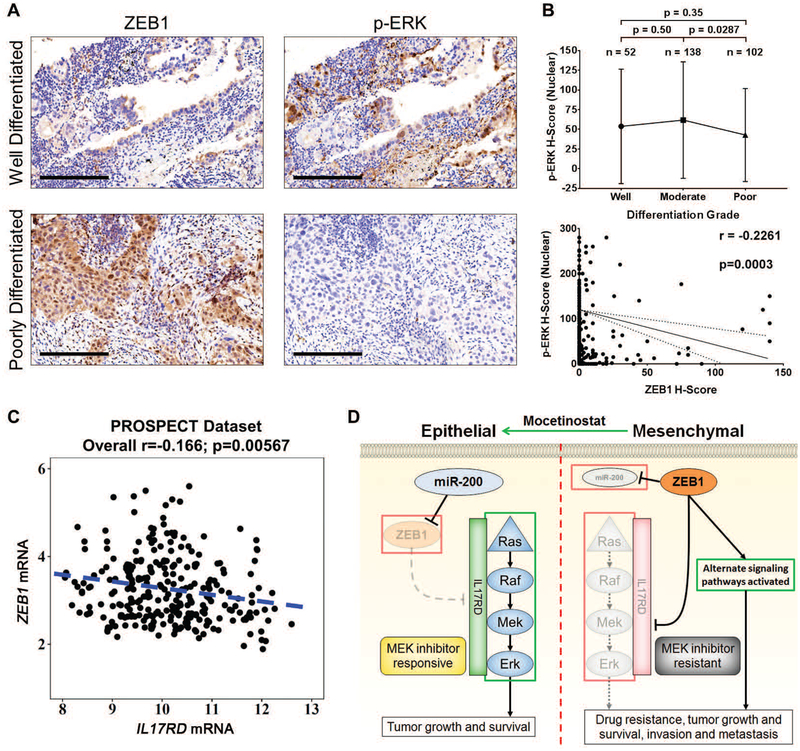
Fig. 8. Lung adenocarcinoma patients with high ZEB1 have lower phosphorylation of ERK.
(A) Examples of well- and poorly-differentiated human lung ADC tissue sections stained by IHC for ZEB1 and p-ERK. Scale bars, 200 μm.
(B) Top: Nuclear H-scores of p-ERK in ADC specimens of different differentiation grades. Bottom: Cluster plot analysis of Spearman’s rank correlation between ZEB1 and nuclear p-ERK H-scores in ADC specimens. Solid line indicates the linear correlation and dotted lines represent 90% confidence bands.
(C) Cluster plot analysis of Spearman’s rank correlation between ZEB1 and IL17RD mRNA expression in human lung cancer patient tumor samples from PROSPECT dataset.
(D) Proposed model demonstrating differential MAPK signaling pathway activation and sensitivity to MEK inhibitor treatment between epithelial and mesenchymal lung cancer cells due to ZEB1 regulation of IL17RD expression.

