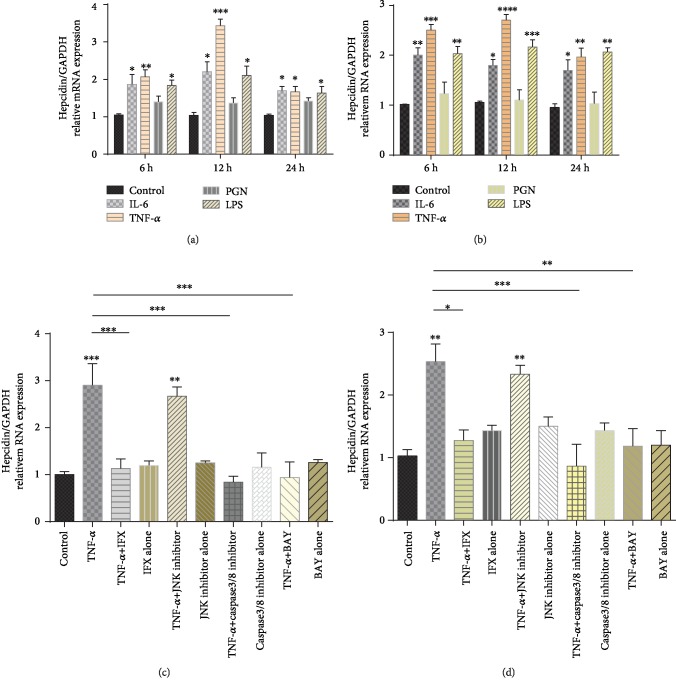
Figure 5.
TNF-α upregulates hepcidin expression in liver cell line in caspase 3/8- and NF-κB-dependent manners. (a) LO2 cell line and (b) HepG2 cell line were cultured in vitro and stimulated with IL-6 (10 ng/mL), TNF-α (10 ng/mL), PGN (100 ng/mL), and LPS (100 ng/mL), respectively. After 6, 12, and 24 h of culture, cells were collected and the mRNA levels of hepcidin were determined by qRT-PCR. One-way ANOVA was performed for statistical analysis. ∗P < 0.05, ∗∗P < 0.01, ∗∗∗P < 0.001, and ∗∗∗∗P < 0.0001 versus controls. (c) LO2 cell line and (d) HepG2 cell line were incubated with TNF-α (10 ng/mL) in the presence of anti-TNF-α mAb (IFX, 50 ng/μL), JNK inhibitor (JNK-IN-8, 10 μM), NF-κB inhibitor (BAY 11-7082, 10 μM), and caspase-3/8 inhibitor (Z-DEVD-FMK, 50 μM), respectively, as indicated. After 12 h of culture, cells were collected and qRT-PCR was used to determine mRNA levels of hepcidin expression. ∗∗P < 0.01, ∗∗∗P < 0.001. GAPDH mRNA levels in each sample were used to normalize gene expression, and the graph represents the combined data of 3 independent experiment (N = 3) done each one in triplicate.

