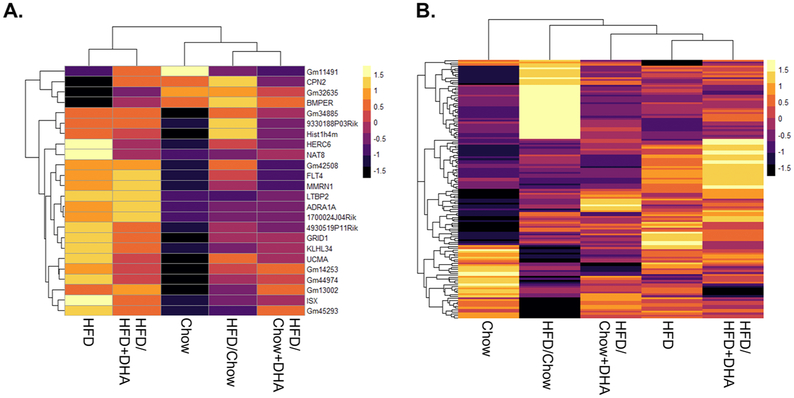
Figure 6. Ovarian Gene Expression Changes Following Dietary Intervention.
RNA-sequencing was conducted on the whole ovary to determine genes with altered expression after dietary intervention. A. Heatmap of the 24 genes (normalized log counts per million) found the be differentially regulated in the HFD mice compared to the chow controls was plotted for each dietary intervention group. B. Heat map of normalized log counts per million of all genes included in RNA-sequencing analysis plotted for each dietary intervention.

