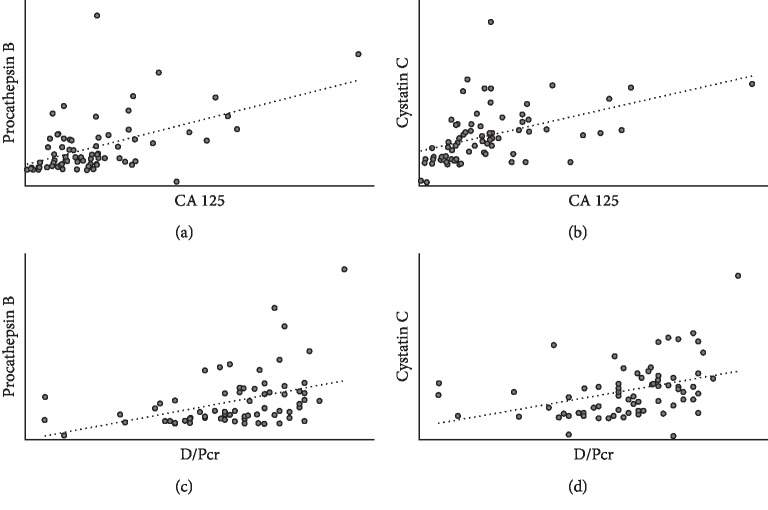
Figure 2.
CA 125 correlation with procathepsin B (a) and cystatin C (b) and D/Pcr correlation with procathepsin B (c) and cystatin C (d) levels in PD effluent. Procathepsin B and cystatin C levels were positively correlated with CA 125 levels in PD effluent (r2 = 0.285, p < 0.001 and r2 = 0.444, p < 0.001, respectively). D/Pcr was also correlated with procathepsin B (r2 = 0.39, p=0.001) and cystatin C (r2 = 0.41, p=0.001) in PD effluent.

