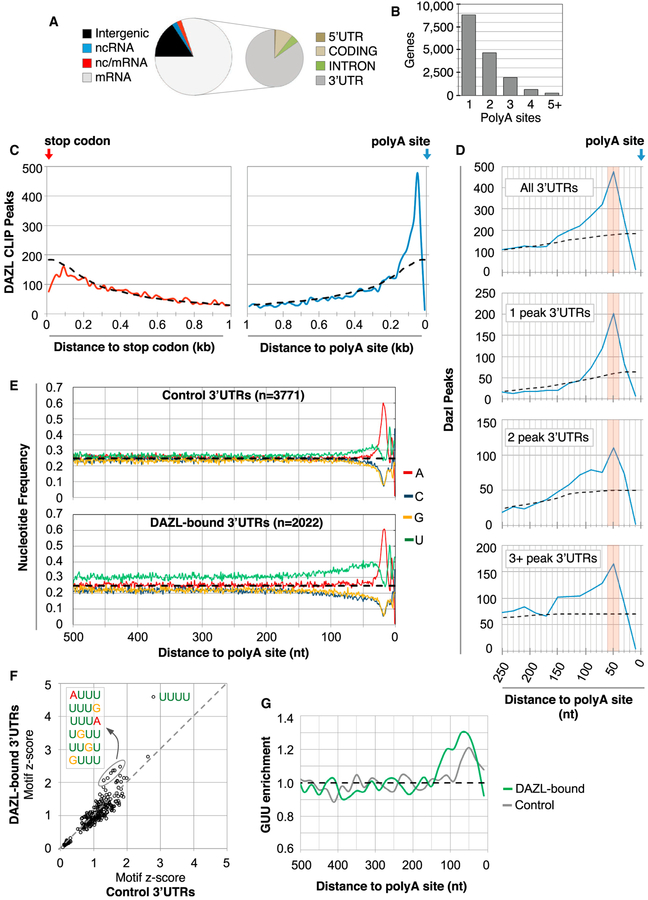
Figure 2. DAZL Predominantly Binds 3′ UTRs at PolyA-Proximal Sites.
(A) Distribution of BR3 CLIP sites in different genic regions. BR3 clusters mapped to regions with overlapping coding and non-coding RNAs were annotated as nc/mRNA.
(B) Number of genes with ≥1 polyA site, as determined by polyA-seq analysis.
(C) Metagene analysis of DAZL CLIP peaks in 20 nt bins relative to the stop codon (left, red line) or the polyA site (right, blue line). Dashed line represents the expected random distribution.
(D) Top corresponds to a higher magnification view of the right part of (C). The bottom three parts show CLIP peak distribution relative to the polyA site in 3′ UTRs with 1, 2, or more peaks in the entire 3′ UTR.
(E) Nucleotide frequency 500 nt upstream of polyA sites of control 3′ UTRs (no DAZL CLIP reads, top), and 3′ UTRs with DAZL-RNA interactions (bottom).
(F) Motif enrichment in 3′ UTRs with and without DAZL CLIP peaks (y and x axes, respectively), where values correspond to Z scores.
(G) GUU enrichment (observed/expected) in 3′ UTRs with and without Dazl CLIP peaks (green and gray lines, respectively).

