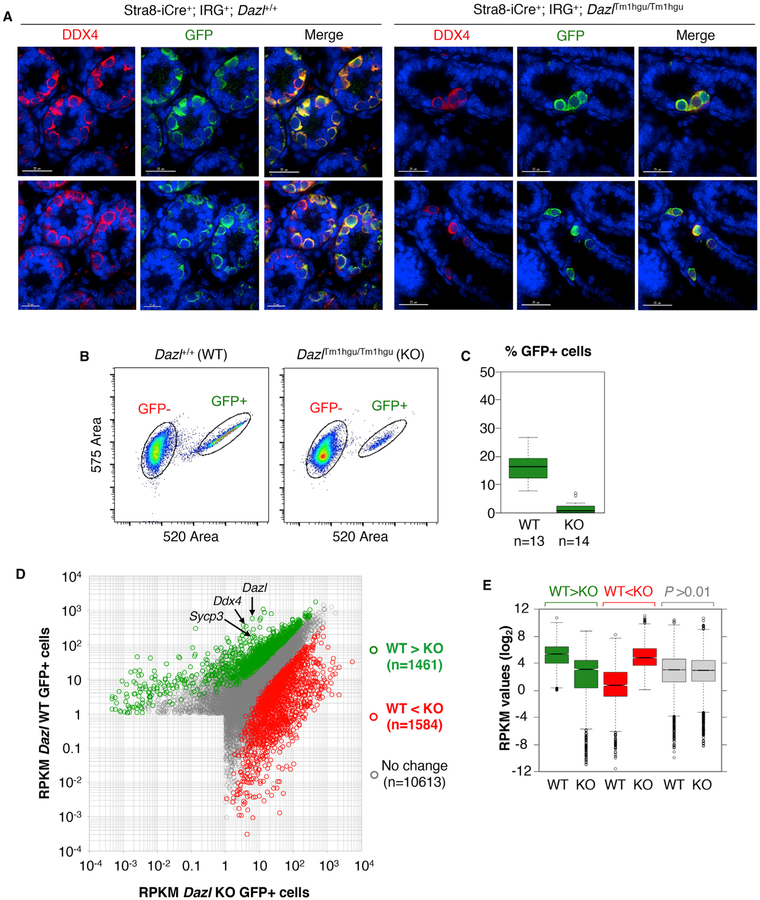
Figure 3. Genetic Labeling, Isolation, and Transcriptome Profiling of GFP+ WT and Dazl KO Germ Cells.
(A) IF of DDX4 and GFP in Stra8-iCre+; IRG+; Dazl2+ (Dazl WT) and Stra8-iCre+; IRG+; DazlTm1hgu/Tm1hgu (Dazl KO) testes at P6 (left and right, respectively). Sections from biological replicates are shown in the top and bottom rows. Scale bars for bottom WT panels represent 15 μM, all others represent 25 μM.
(B) Flow cytometry plots of GFP− and GFP+ cells from WT and KO mice.
(C) Percentage of GFP+ cells isolated by FACS from P6 WT and Dazl KO mice.
(D) Scatterplot of RPKM values for genes in WT and KO cells. Green and red dots denote genes with decreased and increased RNA levels in Dazl KO cells compared to WT controls.
(E) Boxplot showing the distribution of RPKM values for green, red, and gray genes indicated in (D).

