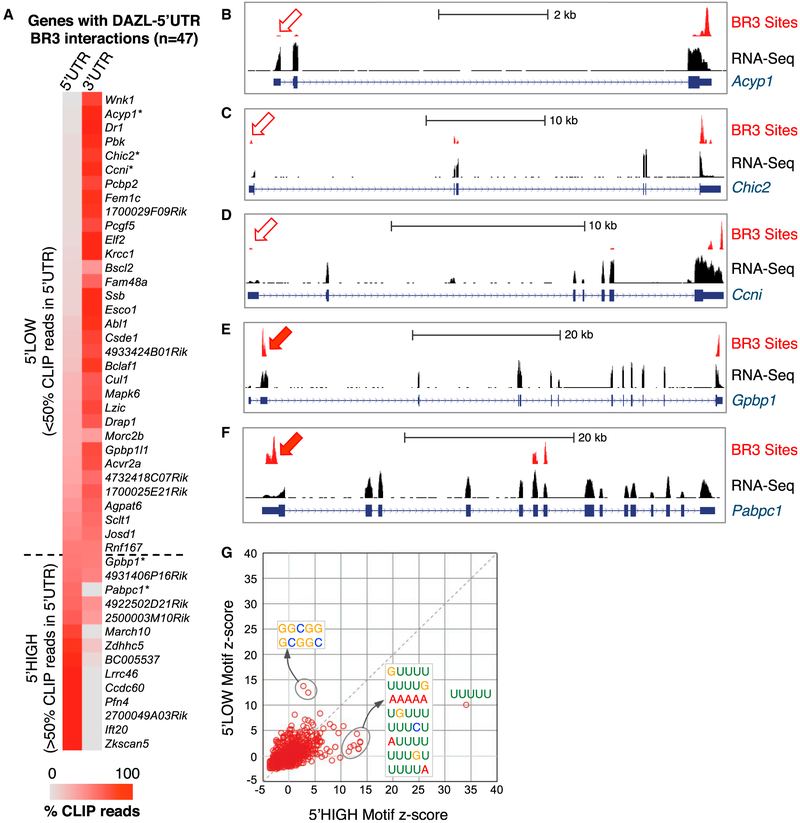
Figure 5. Rare DAZL-RNA Interactions in 5′ UTRs Are Associated with Enrichment of PolyA Tracts.
(A) Comparison of BR3 CLIP tag density in the 5′ and 3′ UTRs of genes with 5′ UTR BR3 CLIP sites. Color coding represents the percentage of BR3 tags in the gene that map to either the 5′ UTR or the 3′ UTR. Dashed line denotes cutoff between genes with <50% (above) or >50% (below) of the CLIP reads in the 5′ UTR. (B–F) Representative examples of 5′ low (B–D) and 5′ high (E and F) genes with CLIP read density in BR3 regions and RNA-seq read density shown.(G) Motif enrichment in 5′ UTRs with >50% or <50% of total BR3 CLIP reads in the 5′ UTR.

