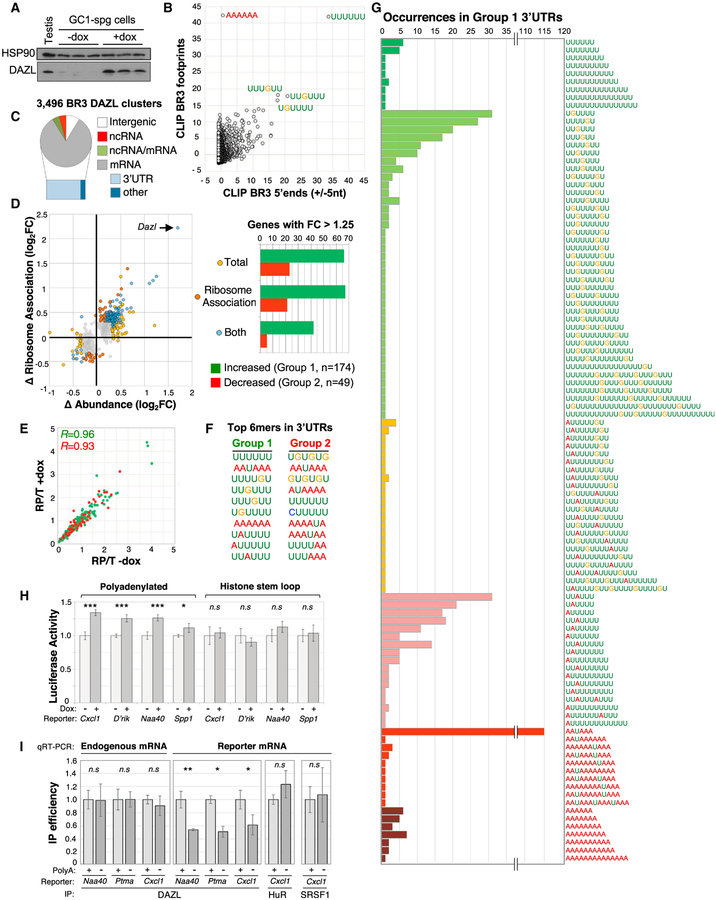
Figure 6. The PolyA Tail Has an Important Role in DAZL-RNA Binding and Regulation.
(A) Western blot showing dox-induced expression of DAZL in GC-1 spg cells used for RNA-seq analyses.
(B) Distribution of Z scores following motif-enrichment analysis of complete regions of BR3 positions bearing overlapping CLIP reads (y axis) or 10 nt regions centered at the 5′ end of BR3 sites (x axis).
(C) Distribution of BR3 CLIP sites across the genome.
(D) Left: fold change in mRNA ribosome association (y axis) and total mRNA level (x axis) for 894 genes following dox induction of DAZL expression. Right: bar chart of 223 genes with ≥1.25-fold change in mRNA association with ribosomes, change in total mRNA level, or both, following DAZL expression.
(E) Distribution of ribosome-protected to total mRNA (RP/T) ratios for group 1 and group 2 genes (green and red, respectively) before and after dox treatment.
(F) Top 10 most-enriched 6mers in last 250 nt of groups 1 and 2 3′ UTRs.
(G) Extended polyU tracts in group 1 3′ UTRs revealed by examining the distribution of the top 10 motifs (F) in each group 1 3′ UTR and merging any that overlap.
(H) Luciferase activity in untreated and dox-treated cells transfected with luciferase mRNA reporters bearing polyadenylated and non-polyadenylated 3′ UTRs of the indicated genes. D’Rik corresponds to reporters bearing the 3′ UTR of D030056L22Rik.
(I) Immunoprecipitation (IP) efficiency of endogenous D030056L22Rik mRNA and luciferase mRNA in dox-treated cells transfected with polyadenylated and non-polyadenylated versions of 3 different 3′ UTRs.
Values in (H) and (I) are averages and SDs from 3 to 5 replicate experiments.
*p < 0.05, **p < 0.01, ***p < 0.0001; n.s. denotes no statistically significant difference.

