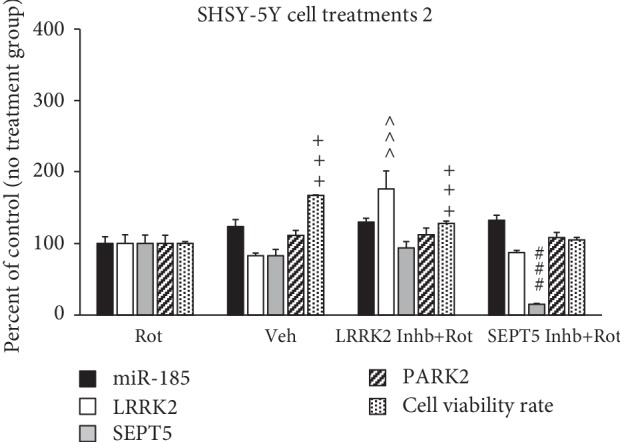
Figure 4.

Comparison of the gene expression in SHSY-5Y cell treated by different treatments. The bands were normalized to beta-actin, and data were presented as percentage of the control group. Data are expressed as mean ± standard error of the mean. P values of less than 0.05 were considered as significant. ∗∗∗P values at <0.001, ^^^P values at <0.001, and ###P < 0.001 represent a significant difference in miR-185, LRRK2, and SEPT5 gene expressions, respectively, between the Rot (control) group and other groups. +++P value at <0.001 represents a significant difference in the cell viability rate between the Rot (Control) group and other groups. Abbreviations are as follows: Rot represents rotenone; Veh represents vehicle; Inhb represents inhibitor.
