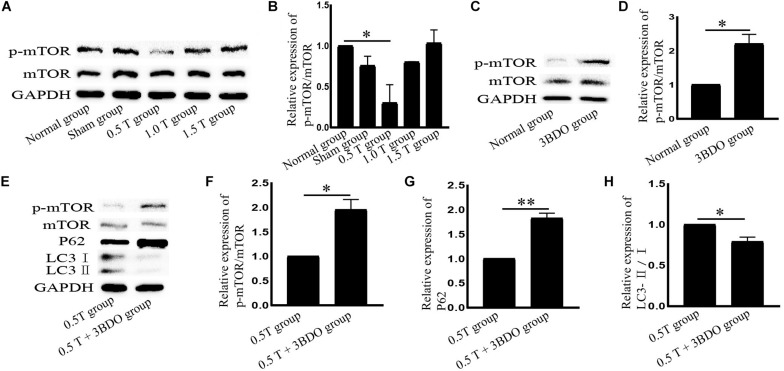
FIGURE 3.
Repetitive transcranial magnetic stimulation (rTMS) mediates autophagy via mTOR. (A) p-mTOR and mTOR assessed by western blotting. (B) Quantification of western blotting for p-mTOR/mTOR. Data were analyzed with a one-way ANOVA followed by Dunnett’s multiple comparison test. ∗P < 0.05, n = 3. Error bars = SD. The value of p-mTOR/mTOR in the 0.5 T group was 0.301 ± 0.223. (C) p-mTOR and mTOR assessed by western blotting after normal group cotreatment with 3BDO. (D) Quantification of western blotting for p-mTOR/mTOR. Data were analyzed with a Student’s t-test. ∗P < 0.05, n = 3. Error bars = SD. The value of p-mTOR/mTOR in the MK801 group was 2.200 ± 0.283. (E) After cotreatment with 3BDO, the expression of p-mTOR, mTOR, LC3, and p62 was assessed by western blotting. (F–H) Quantification of western blotting for p-mTOR/mTOR, LC3-II/I, and p62. Data were analyzed with a Student’s t-test. ∗P < 0.05, ∗∗P < 0.01, n = 3. Error bars = SD. The values of p-mTOR/mTOR, p62, and LC3-II/I in the 0.5 T + 3BDO group were 1.950 ± 0.212, 1.825 ± 0.106, and 0.790 ± 0.057, respectively. mTOR, mammalian target of rapamycin.

