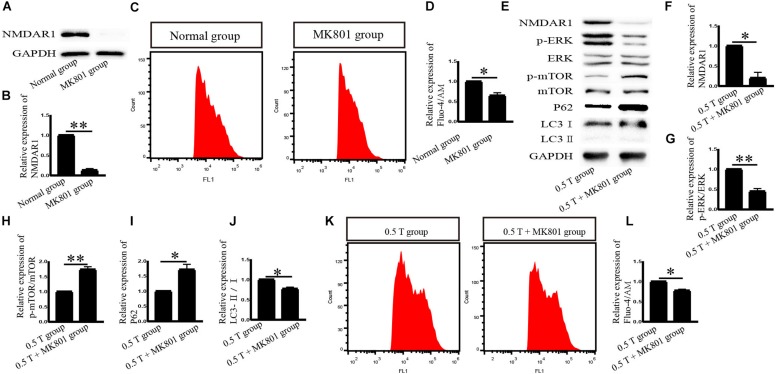
FIGURE 6.
Effects of MK801 on NMDAR1 after incubation with rTMS in bone mesenchymal stromal cells (BMSCs). (A) NMDAR1 assessed by western blotting after normal group cotreatment with MK801. (B) Quantification of western blotting for NMDAR1. Data were analyzed with a Student’s t-test. ∗∗P < 0.01, n = 3. Error bars = SD. The value of NMDAR1 in the MK801 group was 0.130 ± 0.042. (C) Detection of Ca2+ levels after normal group cotreatment with MK801. (D) Quantitative fluorescence intensity of Ca2+ levels. Data were analyzed with a Student’s t-test. ∗P < 0.05, n = 3. Error bars = SD. The value of Ca2+ in the MK801 group was 0.650 ± 0.071. (E) Cells were pretreated with MK801 (10 μM) for 1 h and incubated with rTMS. NMDAR1, ERK, p-ERK, p-mTOR, mTOR, LC3, and p62 were assessed by western blotting. (F–J) Quantification of western blotting for NMDAR1, p-ERK/ERK, p-mTOR/mTOR, LC3-II/I, and p62. Data were analyzed with a Student’s t-test. ∗P < 0.05, ∗∗P < 0.01, n = 3. Error bars = SD. The values of NMDAR1, p-ERK/ERK, p-mTOR/mTOR, p62, and LC3-II/I in the 0.5 T + MK801 group were 0.200 ± 0.141, 0.450 ± 0.071, 1.735 ± 0.092, 1.715 ± 0.177, and 0.770 ± 0.042, respectively. (K) Detection of intracellular Ca2+ levels after cotreatment with MK801. (L) Quantitative fluorescence intensity of Ca2+ levels assessed by Fura-4/AM. Data were analyzed with a Student’s t-test. ∗P < 0.05, n = 3. Error bars = SD. The value of Ca2+ in the 0.5 T + MK801 group was 0.775 ± 0.035. ERK, extracellular signal-regulated kinase; mTOR, mammalian target of rapamycin.

