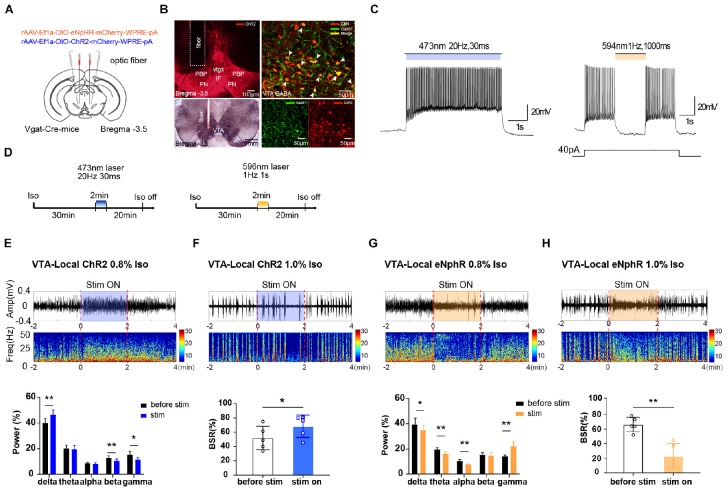
FIGURE 1.
The effect of optogenetic modulating VTA GABAergic neurons during isoflurane anesthesia on EEG. (A) Schematic diagram of optogenetic virus injection and optical stimulation sites. (B) Viral expression (mCherry, red) in GABAergic neurons in the VTA and co-labeling with GABA (GAD67 immunofluorescence, green). White arrows indicate the Gad 67 labeling in the cytoplasm of GABAergic neurons. White lines in the left picture outline the trace of an implanted fiber. (C) Diagram of electrophysiology recording for virus function examination in Vgat-Cre mice. ChR2 virus was irradiated by (473 nm) for 420 s at frequencies of 20 Hz; eNpHR virus by laser irradiation (594 nm) at a frequency of 1 Hz for 1000-ms duration. (D) Diagram showing the protocol of optical activation and inhibition of VTA GABAergic neurons during the inhalation of isoflurane. The colored line represents the time span of laser on (blue for 473-nm laser and yellow for 596-nm laser). Average spectrum (top row) and spectral percentage (bottom row) changes during optical activation (E) and inhibition. (G) The time span from 2 before 2 min after the end of light activation. Average spectrum and BSR changes during optical activation (F) or inhibition (H). The time span is the same as in (D) and (F). ∗P < 0.05, ∗∗P < 0.01. VTA, ventral tegmental area; EEG, electroencephalogram.

