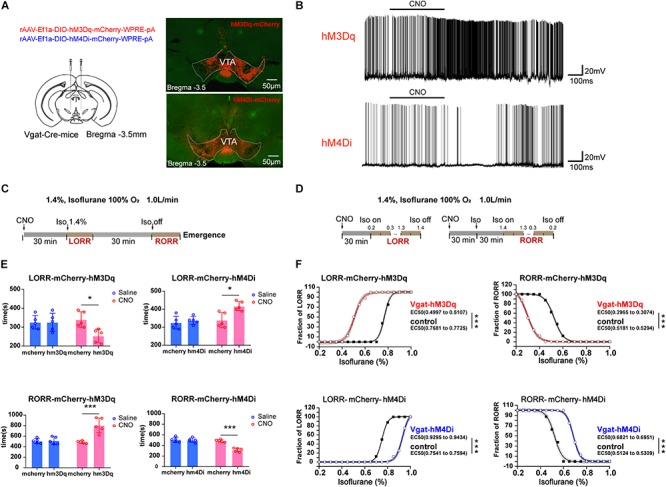
FIGURE 2.

Influences of chemogenetic modulation of VTA GABAergic neurons on anesthetic induction and emergence. (A) Schematic diagram of the chemogenetic virus injection site (left) and viral expression (hM3Dq and hM4Di) in GABAergic neurons in the VTA (right). (B) Diagram of electrophysiology recording for virus function examination of hM3Dq and hM4Di by CNO administration. (C) Schematic diagram of the experimental protocol to observe the effects of VTA GABAergic neuronal activities on time of LORR or RORR under 1.4% isoflurane anesthesia. (D) Schematic diagram of the experiment for calculating EC50 of isoflurane on LORR or RORR. (E) Statistical results for the effects of modulating VTA GABAergic neuron activities on time of LORR and RORR under 1.4% isoflurane anesthesia. (F) Statistical results for the effects of modulating VTA GABAergic neuron activities on EC50 of LORR and RORR under the condition where isoflurane was given progressively. ∗P < 0.05, ∗∗∗P < 0.001. VTA, ventral tegmental area; EEG, electroencephalogram; CNO, clozapine N-oxide; LORR, loss of righting reflex; RORR, recovery of righting reflex.
