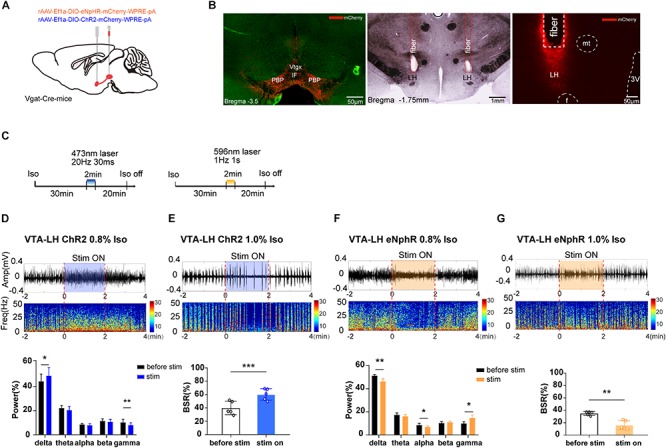
FIGURE 3.

The effect of optogenetic modulation of VTA–LH GABAergic projection on EEG during anesthesia. (A) Schematic diagram of optogenetic virus injection and stimulation sites. (B) Fluorescent confirmation of virus expression (mCherry) in GABAergic neurons in the VTA and LH (Vgat-Cre mice) and the trace of implanted fibers in the LH. (C) Diagrams showing the protocols for optical activation and inhibition of VTA GABAergic terminals in the LH during the isoflurane anesthesia. The colored line represents the time span of laser on (blue for 473-nm laser and yellow for 596-nm laser). Average spectrum (top row) and spectral percentage (bottom row) changes during optical activation (D) and inhibition. (F) The time span from 2 min before to 2 min after the end of light activation. Average spectrum and BSR changes during optical activation (E) or inhibition (G) The time span is the same as in (D) and (F). ∗P < 0.05, ∗∗P < 0.01, and ∗∗∗P < 0.001. VTA, ventral tegmental area; LH, lateral hypothalamus; EEG, EEG, electroencephalogram; CNO, clozapine N-oxide; LORR, loss of righting reflex; RORR, recovery of righting reflex; BSR, burst suppression ratio.
