Figure 2.
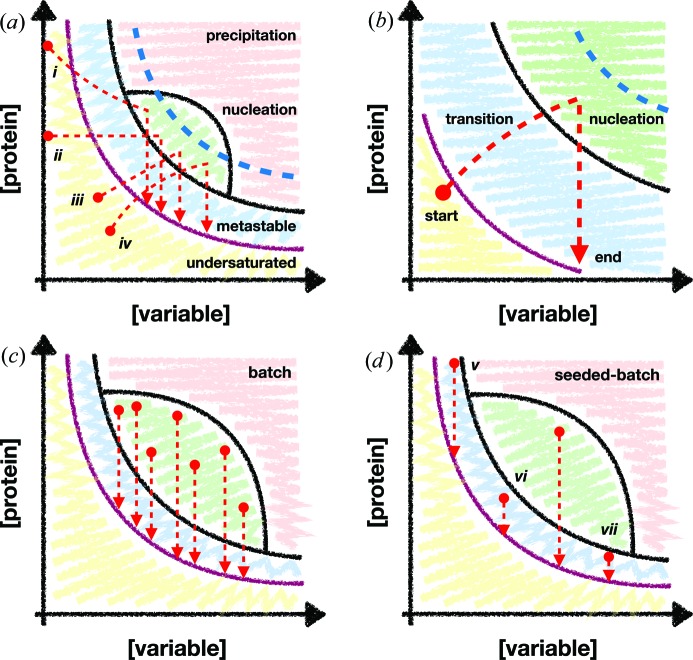
Examples of crystallization trajectories plotted onto phase diagrams. Protein concentration and a reservoir component ‘variable’ concentration are plotted on the y and x axes, respectively. The ‘variable’ could be any factor which may influence the crystallization experiment, e.g. PEG, salt or buffer concentration. The purple lines show the boundary of protein supersaturation [adapted from Chayen et al. (1992 ▸) ▸]. The red circles and arrows denote the starting and finishing points of a crystallization experiment. The regions of the diagram are labelled in panel (a): precipitation, nucleation, metastable and undersaturated, and these are highlighted in pink, green, blue and yellow, respectively. The blue dotted lines show the theoretical limit of nucleation-zone penetration for non-batch methods. Potential crystallization trajectories for the transitionary phase methods of free-interface diffusion (i), dialysis (ii), evaporation (iii) and vapour diffusion (iv) are highlighted. (b) Highlighting the trajectory of a vapour diffusion experiment. The components of the drop must transition from outside to inside the nucleation zone through some process. (c), (d) More diverse examples of batch and seeded-batch experiments, respectively. Batch experiments [panel (c)] are not bound by the nucleation-zone limit and can, therefore, theoretically reach every part of the region. The trajectories v, vi and vii in panel (d) show potential trajectories for growing large single crystals, micro-crystals and micro-crystals from a less-concentrated sample, respectively.

