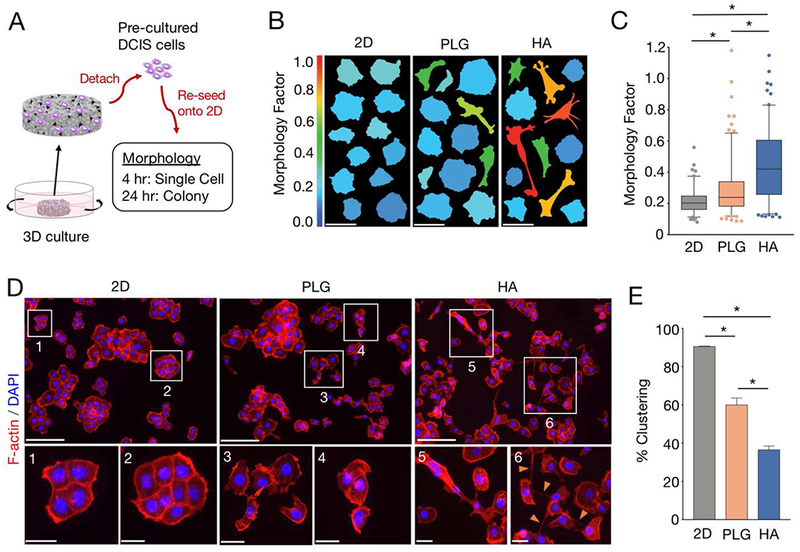
Fig. 4. DCIS cells interacting with hydroxyapatite mineral in 3D culture adopt morphological hallmarks of invasiveness.

(A) Experimental setup for morphological characterization: pre-cultured MCF10DCIS.com (DCIS) cells were detached from scaffolds, re-seeded onto fibronectin-coated glass coverslips, and evaluated for single cell (4 hours) and cell colony (24 hours) morphological characteristics. 2D pre-cultures on polystyrene were used as controls. (B) Representative cell morphologies of F-actin- and DAPI-stained DCIS cells exposed to different pre-culture conditions. Each vertical panel shows thresholded images of 12 representative cells with a mean Morphology Factor (MF) equivalent to the mean MF of each respective condition. Color scale: warmer colors indicate greater MF. Scale bars, 50 μm. (C) Box-and-whisker plots comparing MFs between pre-culture conditions. Whiskers represent the 5th and 95th percentile. Outlier data points are depicted as dots. *p<0.05. (D) Representative fluorescent images from DCIS cells exposed to different pre-culture conditions. Cells were co-stained for F-actin (red) and nuclei (blue). Insets magnify the regions outlined by white boxes. Orange arrows in inset 6 highlight cellular processes. Scale bars: top panels, 200 μm; bottom panels, 50 μm. (E) Graph comparing % clustering between pre-culture conditions. Data are means +/− SD. *p<0.05.
